Real references, synthetic drawings, generated images, ablations and instrument checks. Earlier “best” captions are local to their experiment. Research labels are not confirmed diagnoses. HiESD-derived real image panels: CC BY 4.0, cropped/resized; attribution on the main page.
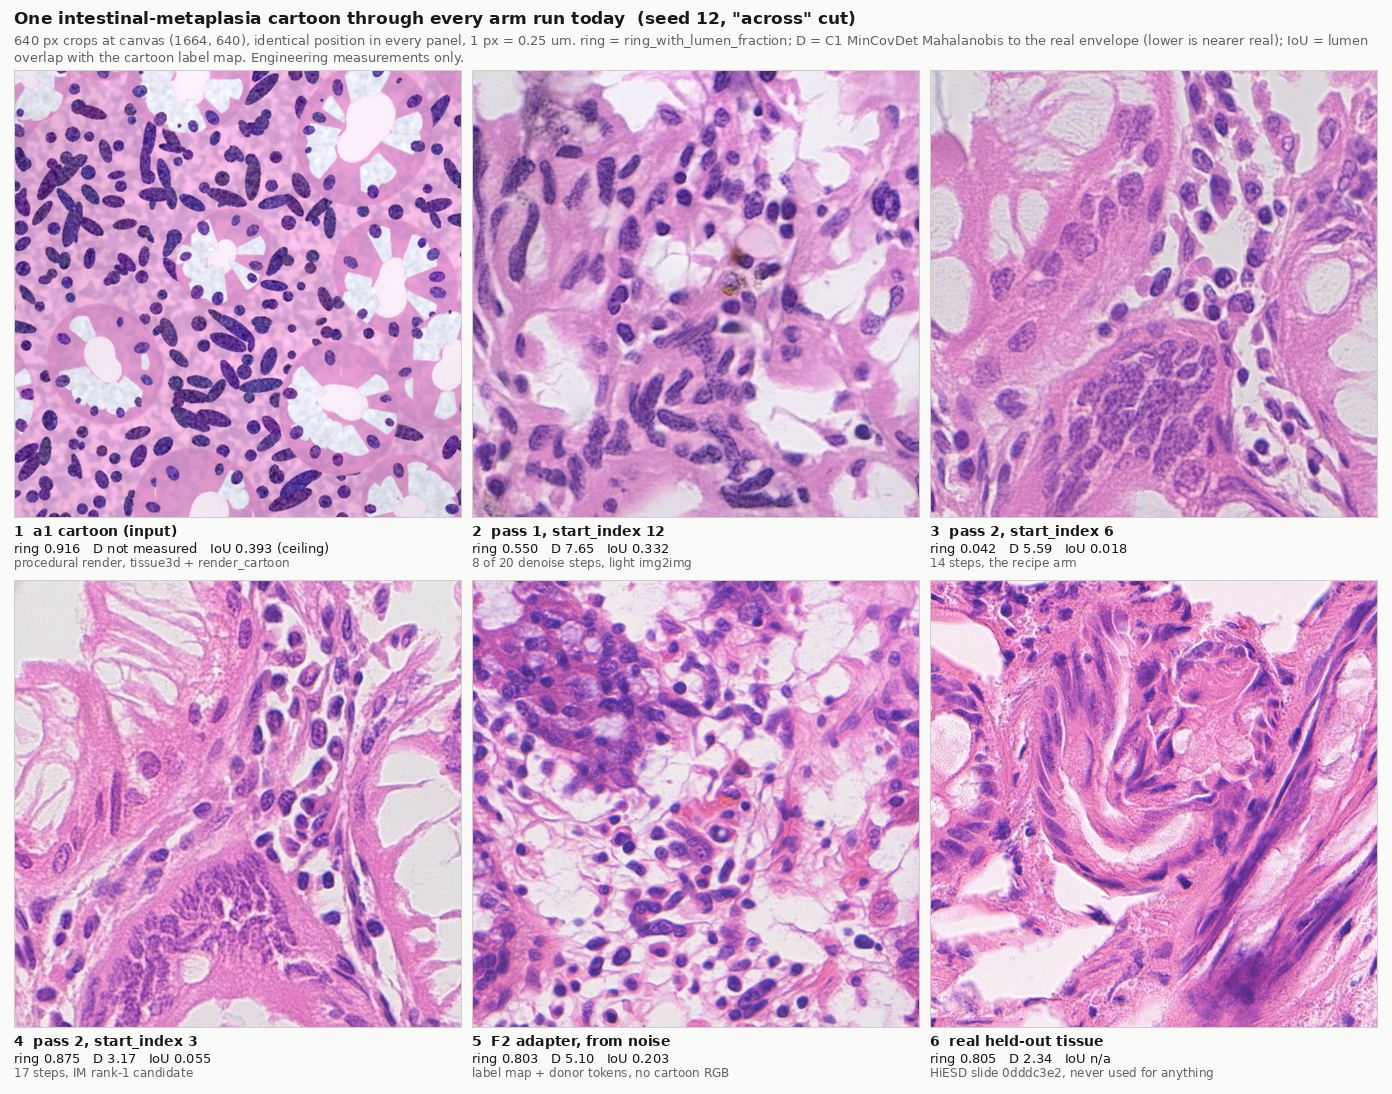
One intestinal-metaplasia cartoon through every arm run today
Six panels in reading order: (1) the a1 cartoon for seed 12, 'across' cut; (2) pass 1 at start_index 12; (3) pass 2 at start_index 6, the recorded recipe; (4) pass 2 at start_index 3; (5) the F2 structure adapter generating from noise on the same cartoon's label map; (6) a real held-out HiESD field. Each panel is labelled with ring = ring_with_lumen_fraction, D = C1 MinCovDet Mahalanobis distance to the real envelope (lower is nearer real), IoU = lumen overlap with the cartoon's own label map. Follow the IoU number across the row: it starts at 0.393 on the drawing itself, is still 0.332 after the light first pass, and then collapses to 0.018 and 0.055 - the layout the drawing supplied is gone by the second pass. Now follow D: it falls from 7.65 to 3.17, so the picture gets closer to real tissue as the layout is discarded. Panel 5 is the exception: the adapter keeps a fifth of the layout (0.203) while sitting at 5.10. Panel 6 is real tissue for scale; note how much more organised it is than any of the others.
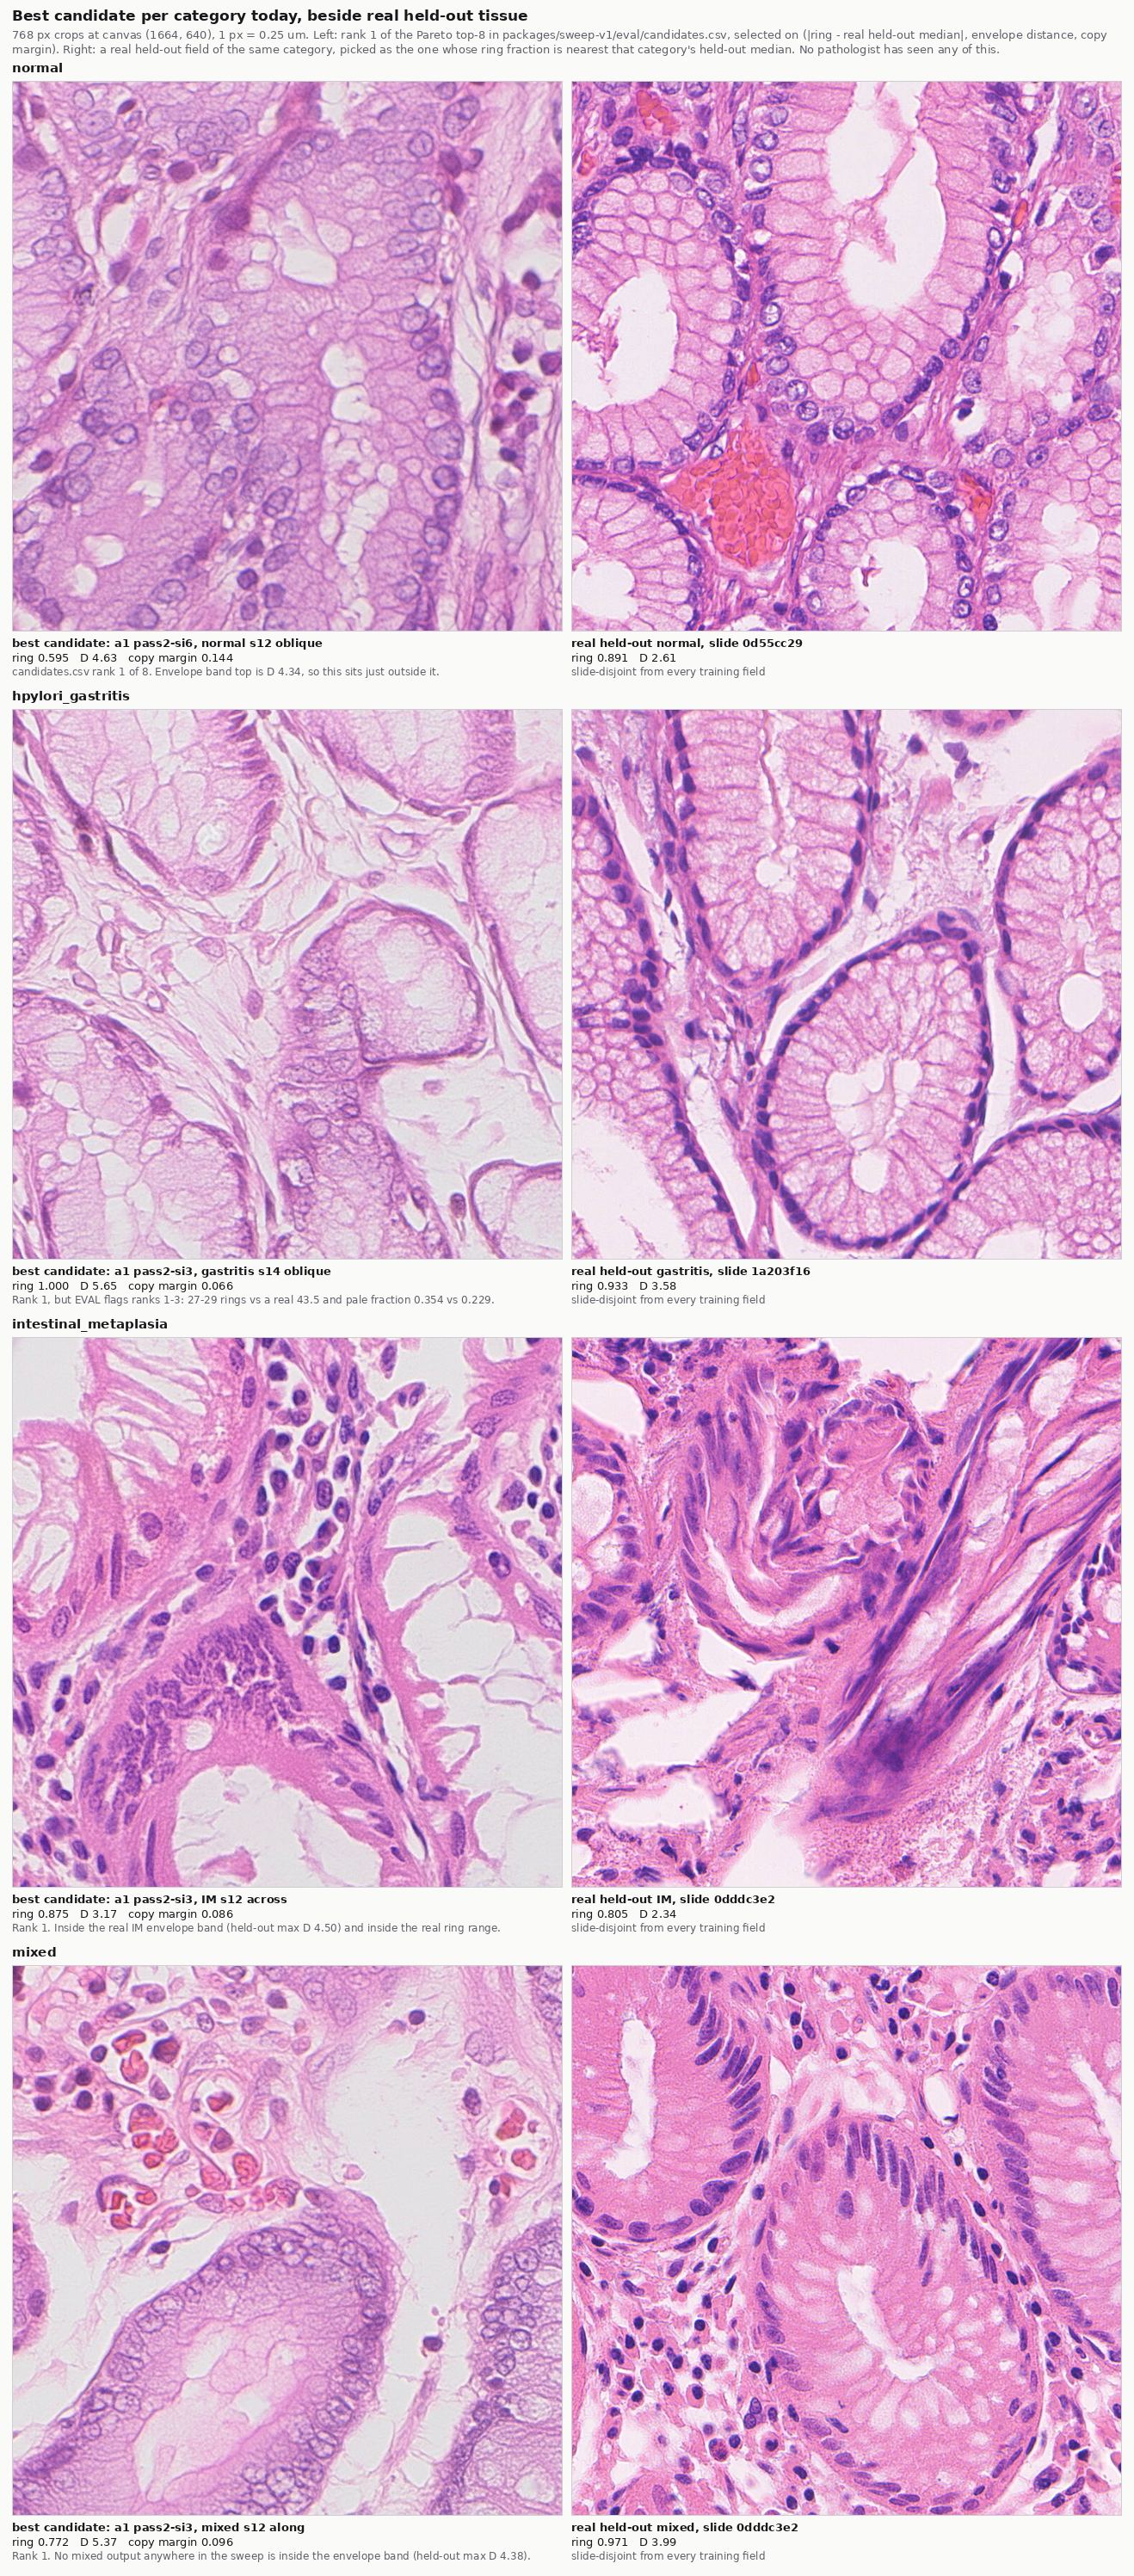
Best candidate per category today, beside real held-out tissue
Four rows, one per category (normal, hpylori_gastritis, intestinal_metaplasia, mixed). Left column: rank 1 of the Pareto top-8 from packages/sweep-v1/eval/candidates.csv, selected on (|ring - real held-out median|, envelope distance, copy margin). Right column: a real held-out field of the same category, chosen as the one whose ring fraction is nearest that category's held-out median. Each panel is labelled with ring and D, and the generated panels carry a one-line caveat. Compare each pair for architecture, not colour. Intestinal metaplasia is the one pair where the generated crop reads as the same kind of tissue as the real one and is inside the real realism band (D 3.17 against a held-out median 2.58). The gastritis pair is the warning: its ring number is a perfect 1.000 and the crop is a pale, hypocellular honeycomb - the selection objective is being gamed. Normal has no gland profiles at all next to a real field full of them.
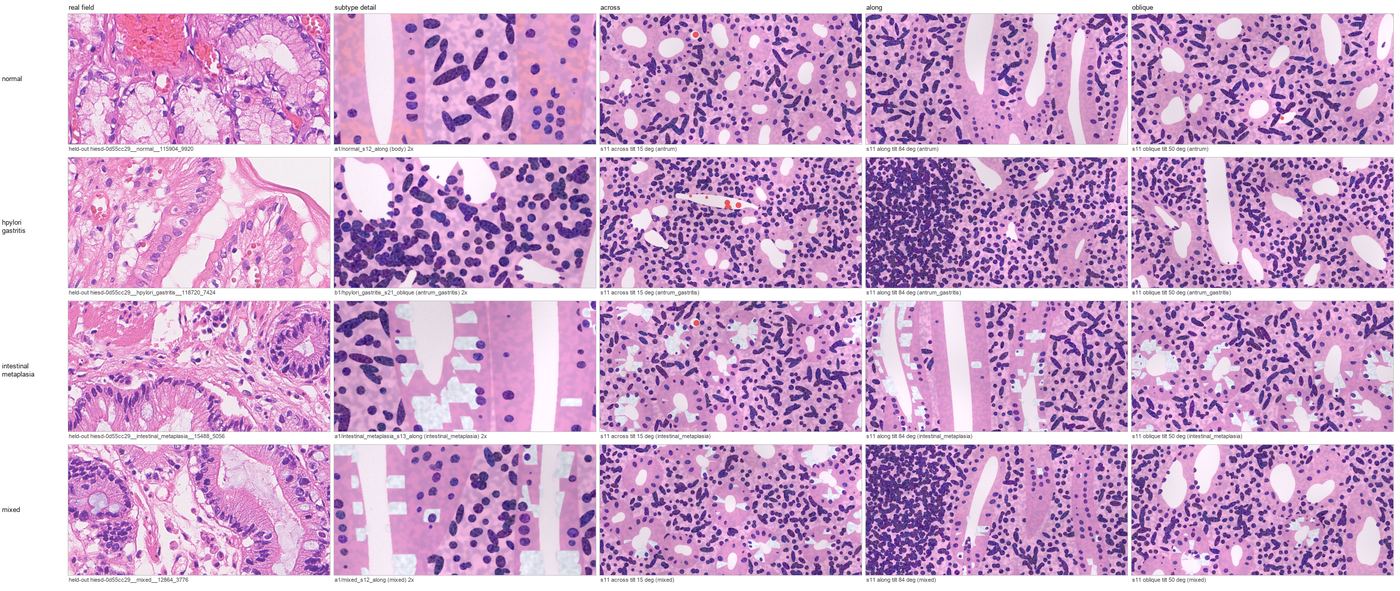
A1 cartoons: real tissue beside the rebuilt procedural renderer, all four categories and all three cut angles
Four rows, one per category (normal, hpylori gastritis, intestinal metaplasia, mixed). Five columns: a real held-out field | a subtype detail at higher zoom | the 'across' cut | the 'along' cut | the 'oblique' cut. The cartoons are conditioning inputs, not outputs, and are meant to look like cartoons. What matters is that the categories now differ in architecture rather than in two numbers: gastritis has deeper pits and denser lamina propria, intestinal metaplasia has goblet vacuoles, normal is body or antrum by seed. Note also how different the three cut angles are - an 'along' cut runs the whole depth of the mucosa and shows tapering tubes rather than ring profiles, which is why it behaves differently on every metric.
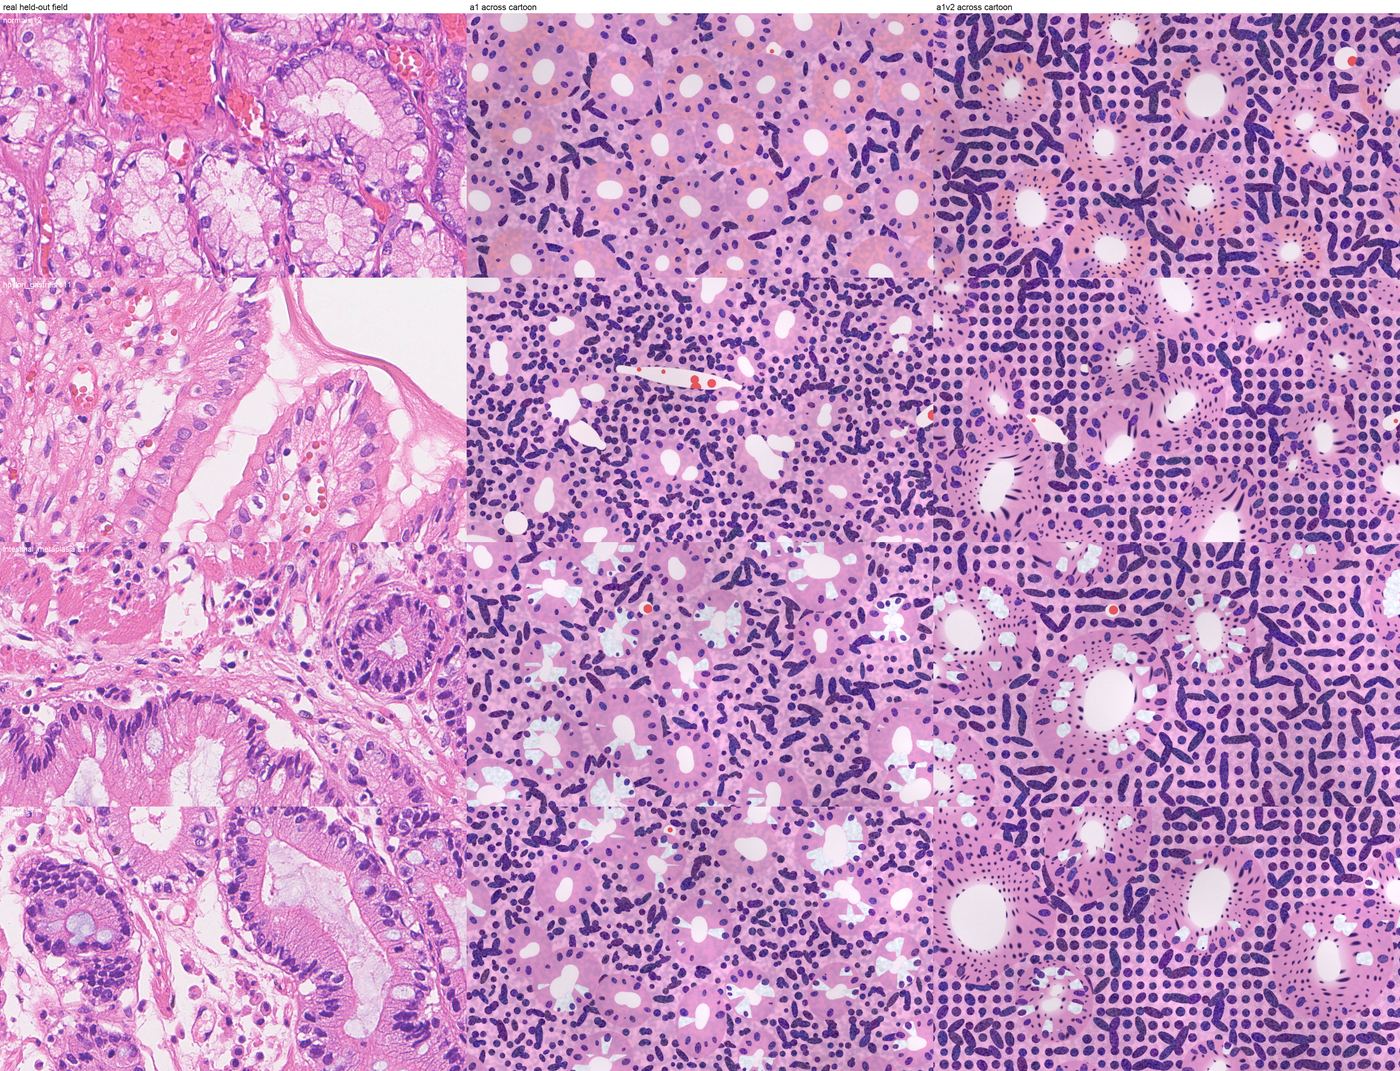
A1 versus A1-V2 gland calibre, at 1:1 pixels
Three columns at native 0.25 um/px, about 300 x 170 um each: a real held-out field | an A1 'across' cartoon | an A1-V2 'across' cartoon. One row per category. The A1 panel is a scatter of 10-20 um white specks with no gland outline - pit-sized rosettes, each split into radial mucin wedges. The A1-V2 panel has discrete round gland profiles you can point at: one connected pale lumen, then a ring of separate goblet vacuoles sitting inside the wall rather than fused with the lumen, then the wall, then a basement rim. The v2 wall also carries a fine dark stipple at about 5.8 um spacing - that is the chromatin-granule lattice, and SWEEP-V2 found the generator reads it as nuclei.
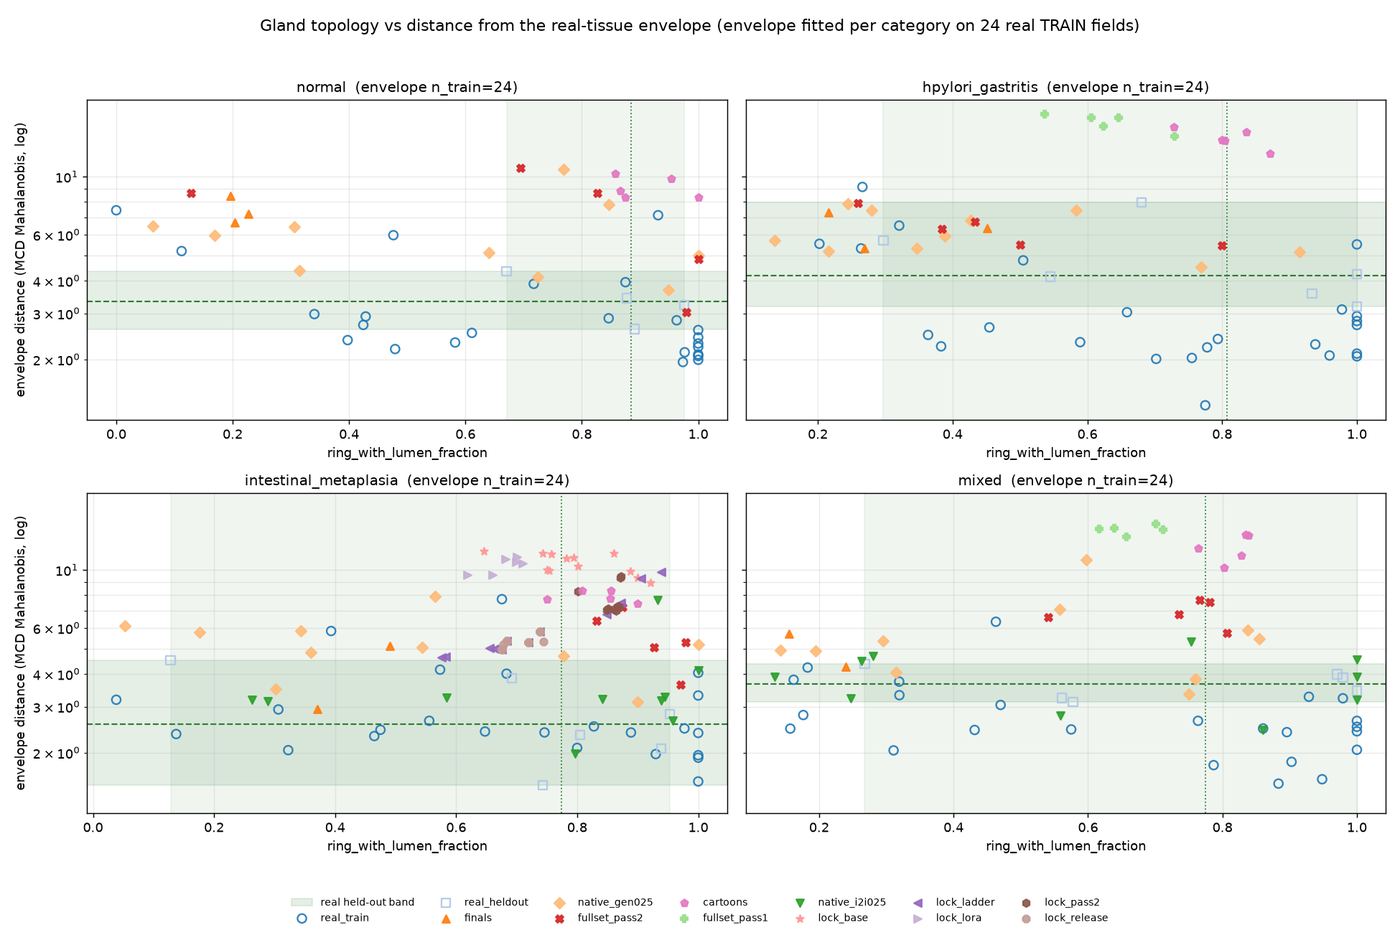
The ring metric does not order the sets; the morphometric envelope does
One panel per category. X axis: ring_with_lumen_fraction. Y axis (log): C1 envelope distance, lower is nearer real. One marker per image, coloured by which generator set it came from. The real held-out band is shaded. The renderer cartoons sit far up the Y axis while their ring fraction (0.80-0.88) is indistinguishable from real tissue - the whole point of the figure. A high ring fraction is compatible with being obviously not tissue.
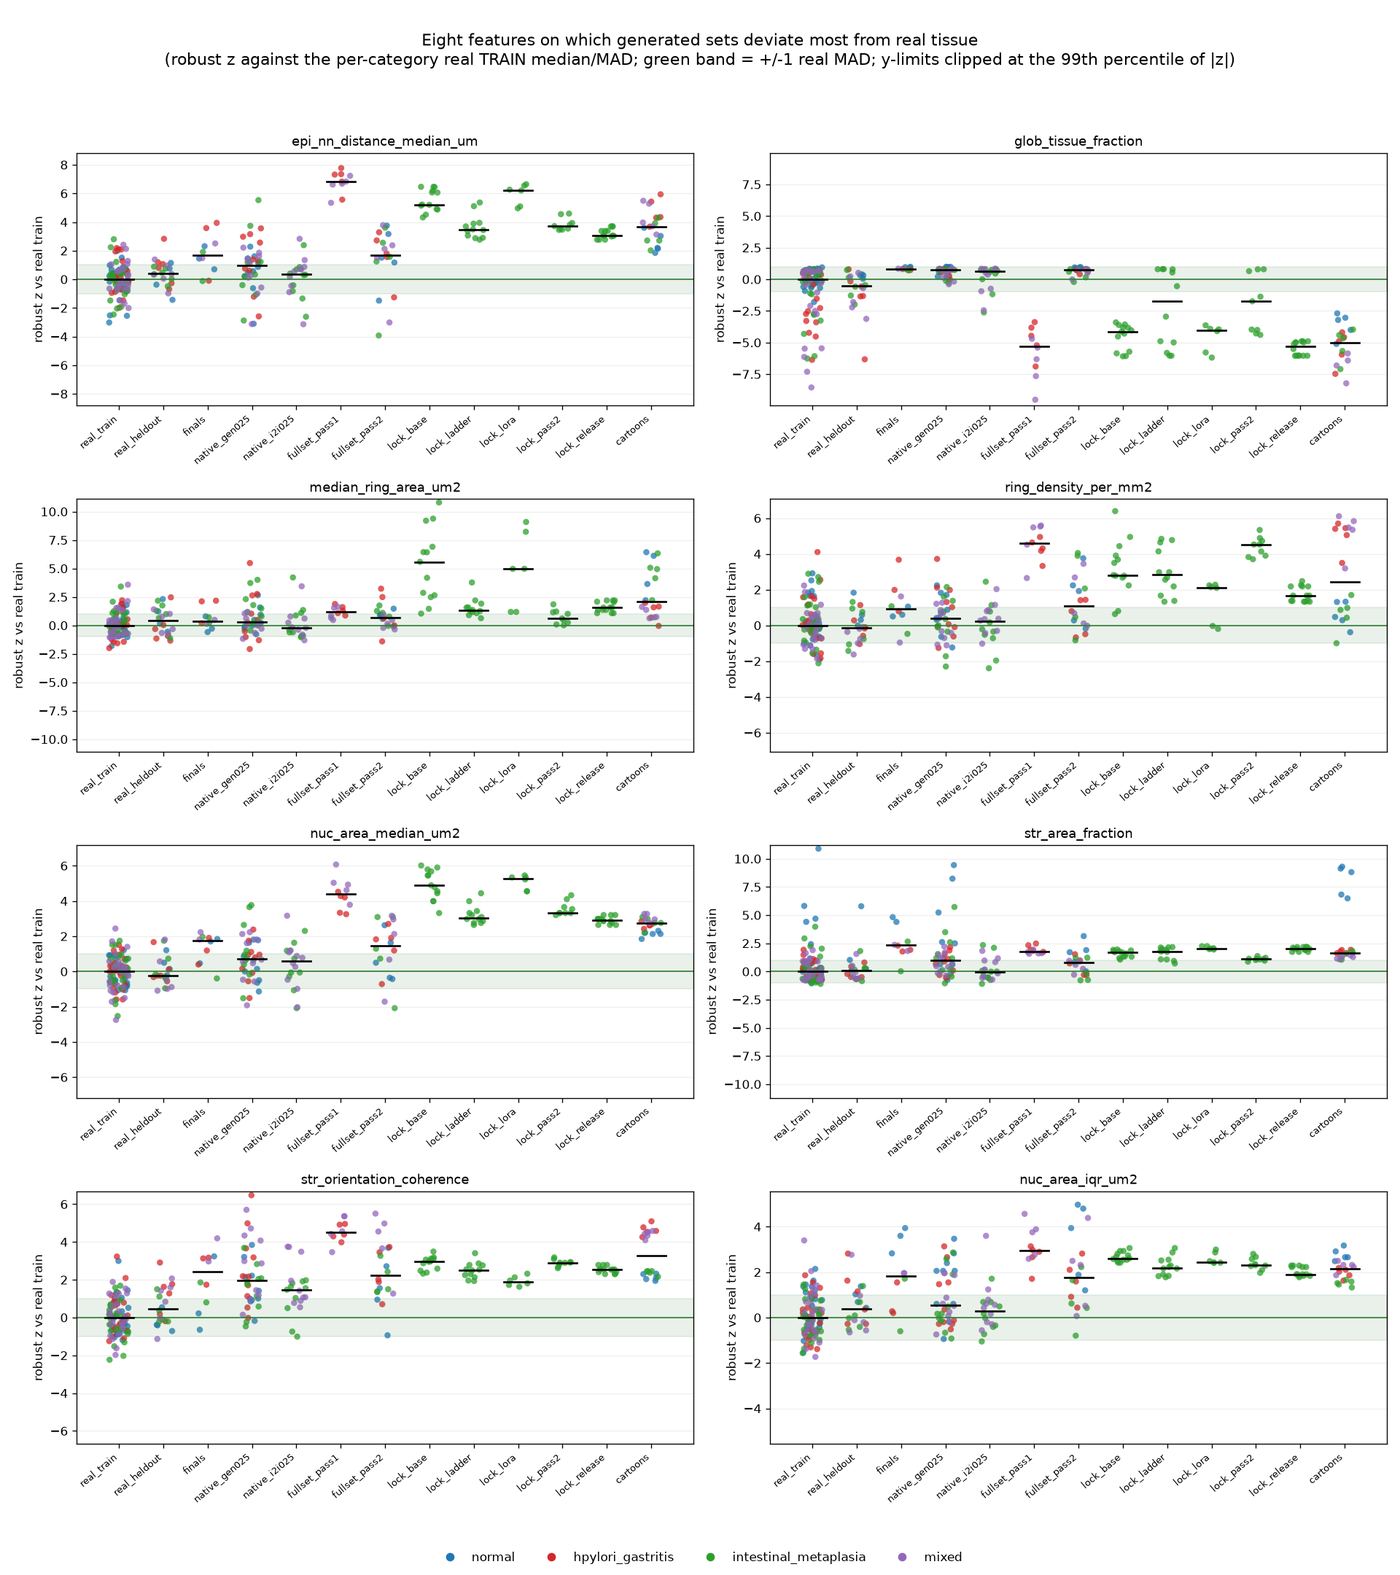
What the generated images actually fail on, feature by feature
One strip per feature, for the eight features on which generated sets deviate most from real. X axis is robust z (0 = the real training median). One marker per image, grouped by generator set, coloured by category. Every generated set is on the same side of the same four features: nuclei too few, too large, too variable in size and spaced too far apart. Cartoon-conditioned arms are the extreme, at z of +5 to +7 on nuclear spacing. The stroma is also too combed (orientation coherence 1.09-1.28x real) and under-populated (stromal nuclear density 0.31-0.68x real). One hypothesis was refuted: epithelial spacing regularity is essentially correct everywhere - the palisade is not too regular, it is too coarse.
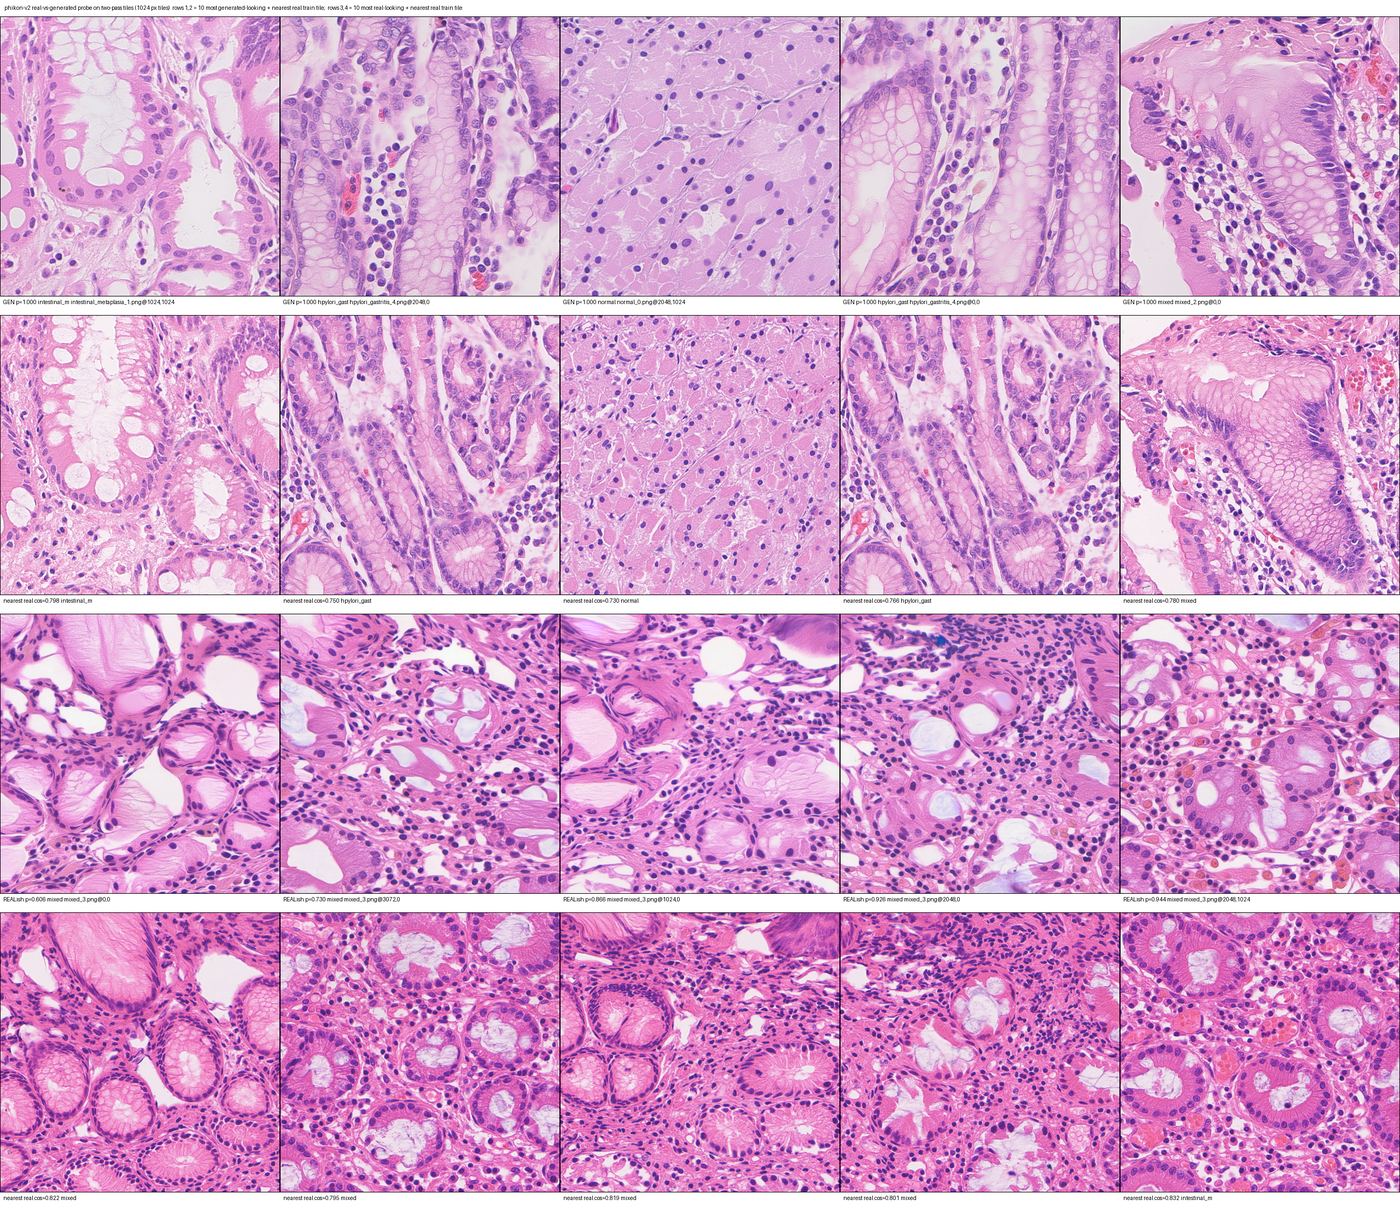
What the pathology encoder is seeing: the most and least generated-looking tiles beside their nearest real neighbours
Four rows of 512 px thumbnails: (1) the most generated-looking two-pass tiles; (2) each one's nearest real training tile; (3) the least generated-looking two-pass tiles; (4) their nearest real training tiles. Every thumbnail is labelled with its probe score. Compare row 1 against row 2, and row 3 against row 4. The difference is texture, not architecture: generated nuclei are smooth evenly-saturated ovals with hard edges and no internal chromatin, the cytoplasm is a flat wash, the pale lines between cells are continuous and of near-constant width, and there is no scanner noise anywhere. Architecture, by contrast, matches well - which is the structure-inheritance effect: 68% of these tiles have their own conditioning donor field as nearest real neighbour (corrected value; chance is about 4%).
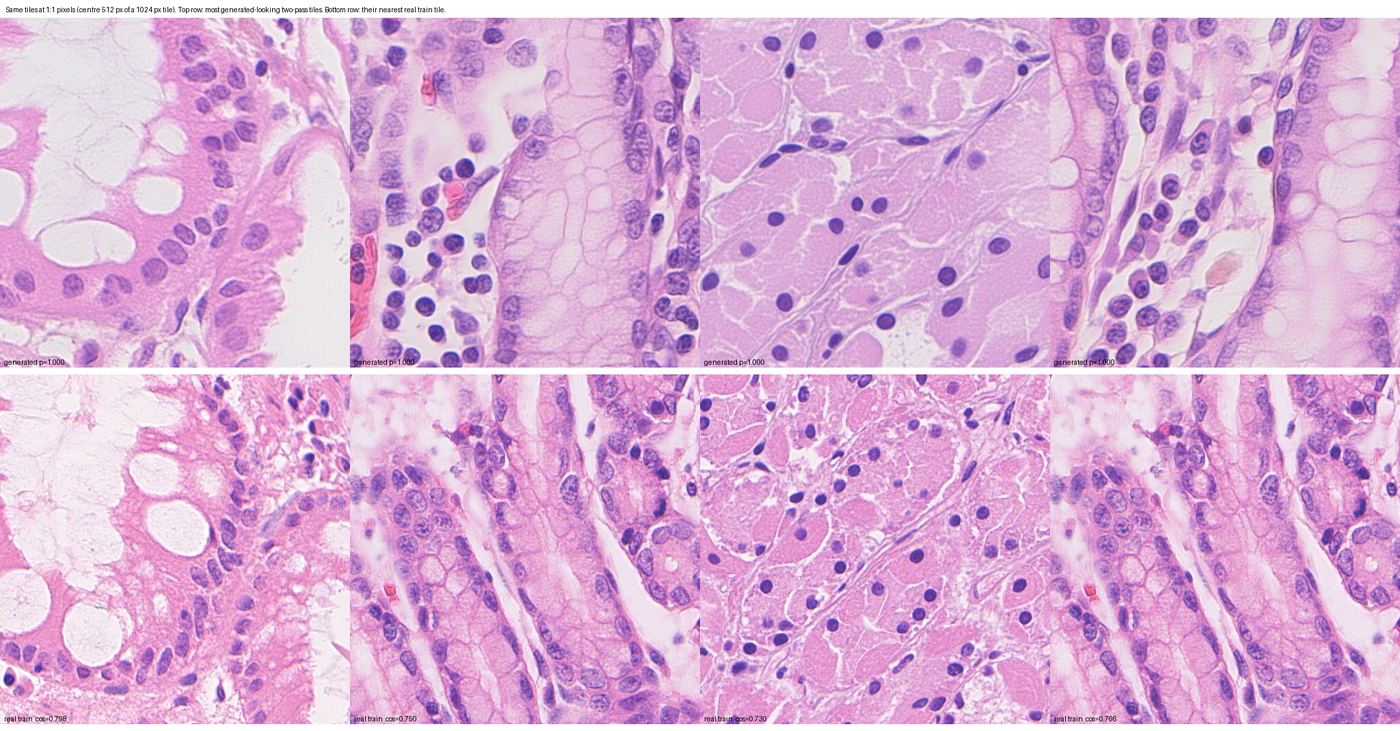
The same tell at 1:1 pixels - the top four generated/real pairs
Four pairs, each a generated tile beside its nearest real training tile, at 1 image pixel per screen pixel. At this magnification the measurable half of the tell is visible directly: the real tiles carry stain granularity and speckled chromatin everywhere; the generated ones are clean. That is the 30% Laplacian deficit (15.45 against a real 21.94) in picture form, and it is the single strongest feature separating the two at AUC 0.938 on its own.
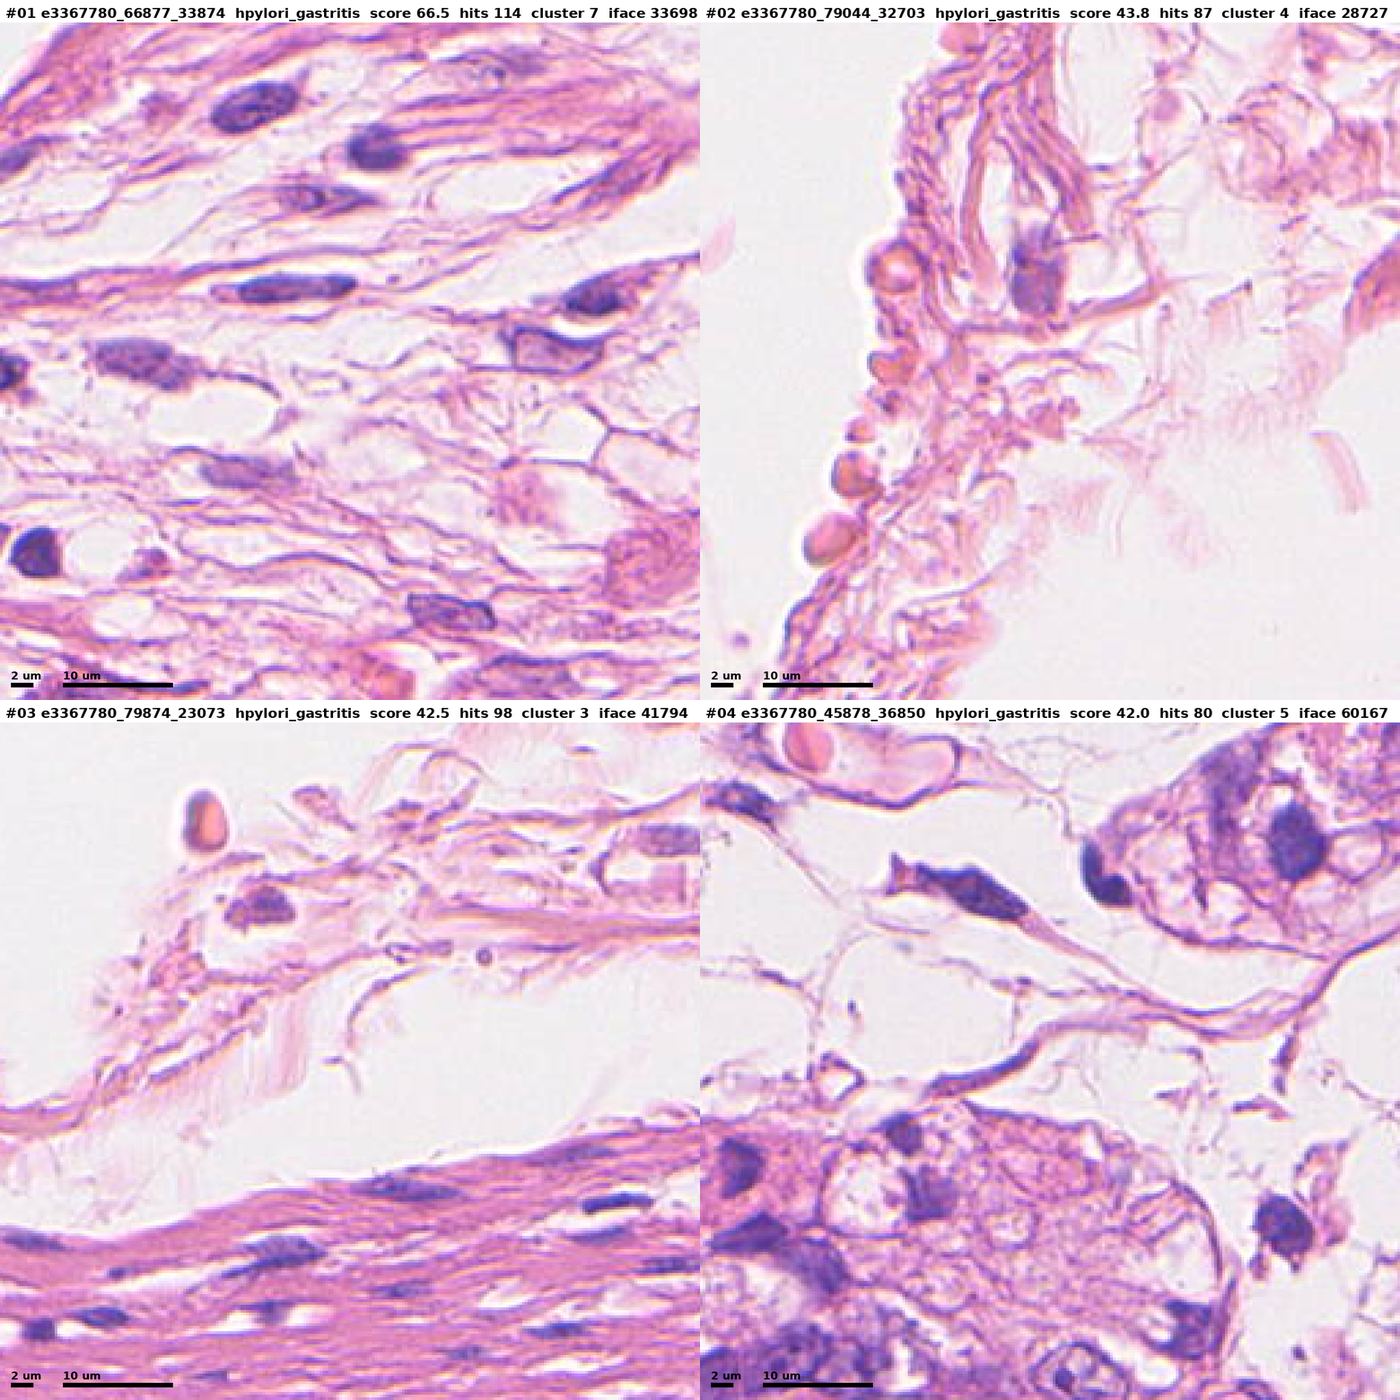
What the H. pylori detector actually found: review sheet 1 of 15
Four candidates in a 2x2 grid at about 3x zoom, ranked 1-4 of 60 by detector score. Each is labelled with slide id, level-0 coordinates, HiESD category, window score, hit count, largest cluster and interface pixels, with 2 um and 10 um scale bars. None of these is an organism. Candidate 1 is collagen and elongated stromal nuclei; candidate 2 is a capillary wall with red cells and fibrin strands; candidates 3 and 4 are muscle bundles and basement membrane. This is what the top of the ranking looks like - 0 of 60 candidates graded 'likely organisms', 5 ambiguous, 55 identifiable as something else (17 fibre, 16 stroma, 12 nuclei, 6 fibrin, 4 epithelium with no organisms).
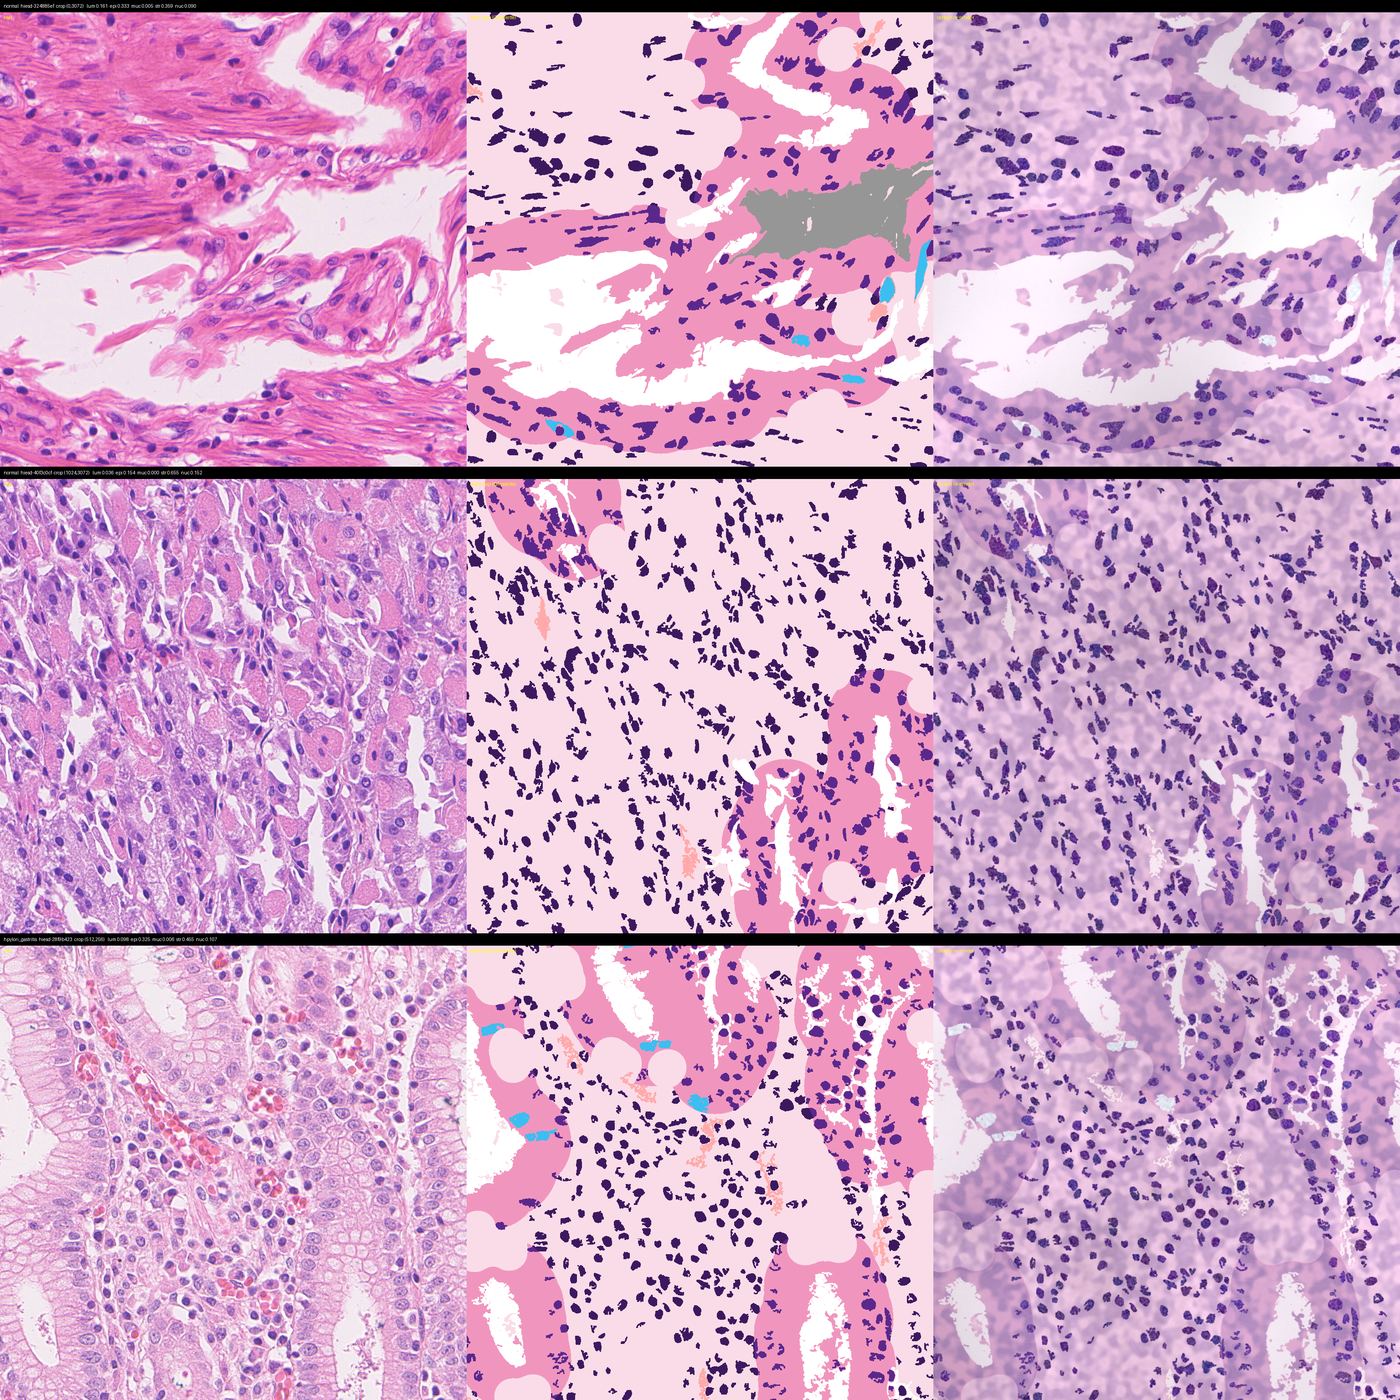
Segmenting real fields into the tissue model's own nine labels - QA sheet, rows 1-3 of 8
Three columns per row: the real 1024 px crop | its automatic label map in a QA palette (glass mid-grey, mucin saturated cyan) | the same label map re-rendered by the programme's own cartoon renderer. The crop shown is the most gland-rich 1024 window of each field by construction. What works: gland rings with a pale lumen, a one-cell-thick epithelial band, a basal nuclear palisade at the outer edge of that band, lamina propria with scattered nuclei. What fails, and is not fixed: goblet mucin is heavily under-called (real segmented mucin 0.004-0.009 of tissue against 0.049-0.056 in the cartoons), and gland epithelium with no visible lumen is labelled stroma because the band is seeded from lumens. Row 2 (normal, oxyntic mucosa cut tangentially) is almost entirely packed glands and the label map calls it epithelium 0.154 / stroma 0.655.
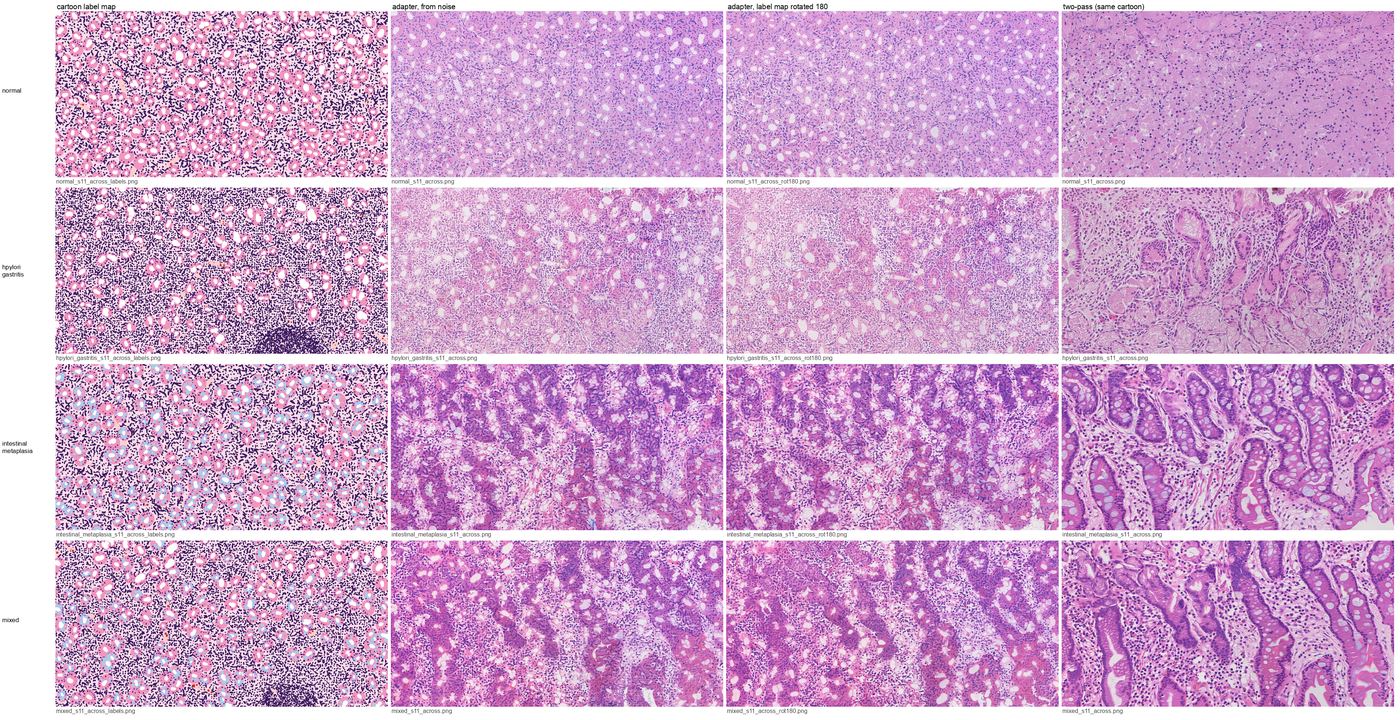
The structure adapter follows the label map, and rotating the map rotates the tissue
One row per category. Four columns: the cartoon's label map | the adapter generating from noise on that map | the adapter with the same map rotated 180 degrees | the two-pass recipe on the same cartoon. Each cell is the whole 4096x2048 field downscaled, so layout is comparable. Read column 1 against column 2: in the gastritis row the label map's dense gland-free patch at lower-centre-right appears as a correspondingly dense pale region in the generated field. Then read column 3: that region has moved to the upper left, because the map was rotated. Column 4 is not obviously related to the label map in any row. The measurement behind this is a layout overlap of 0.26-0.56 for the adapter against 0.10-0.13 for the two-pass recipe, on a chance level of 0.03-0.06.
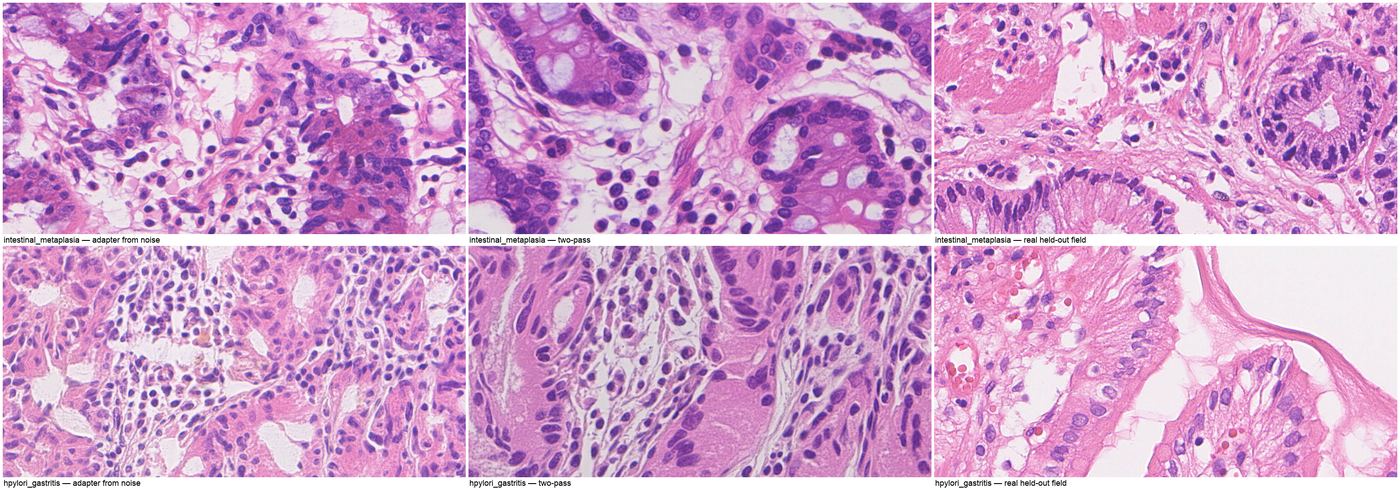
The same comparison at native resolution - where the ranking reverses
Three columns at native 0.25 um/px, 256 x 128 um windows: the adapter's from-noise output | the two-pass output on the same cartoon | a real held-out field. Rows are one IM and one gastritis cartoon. The order flips relative to the field-scale sheet. The two-pass crops have convincing one-cell-thick epithelial bands with elongated basally-oriented nuclei, goblet-type vacuoles in the IM crop and stromal collagen strands. The adapter crops are grainier and flatter: nuclei small, round, soft-edged and scattered evenly rather than polarised into a band, cytoplasm a washed pink, no red cells. The pale holes are the right size but their walls are a crowd of small nuclei rather than a palisade. The adapter has learned WHERE to put tissue and not yet WHAT tissue looks like up close; the two-pass recipe is the other way round.
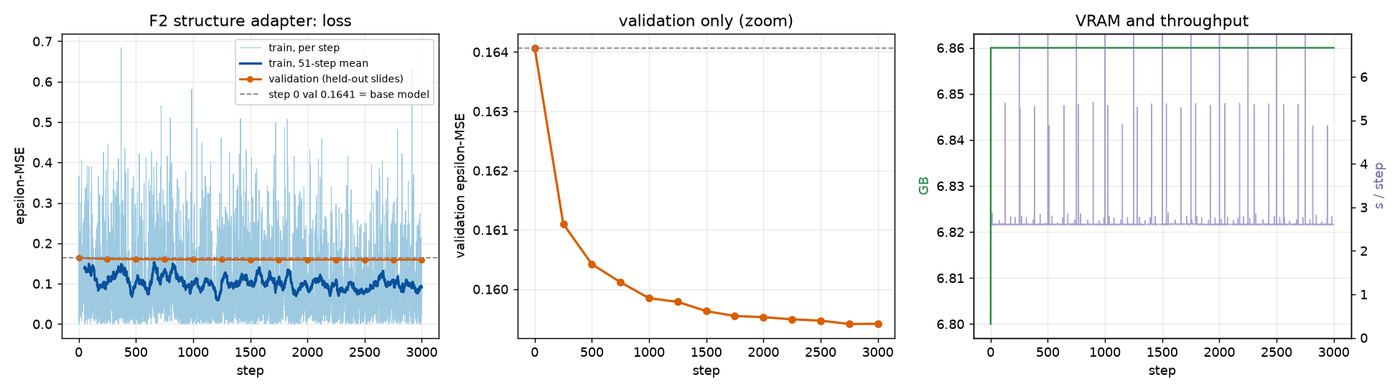
Structure adapter training: loss, validation and throughput over 3000 steps
Three panels: training and validation epsilon-MSE against step; gradient norm; peak VRAM and seconds per step. The validation loss (fixed crops, fixed noise, fixed timesteps) falls from 0.1641 at step 0 - where the zero-initialised adapter is bit-identical to the base model - to 0.1594 at step 3000, a 2.9% relative drop, and is essentially flat after step 1500. That is a weak signal on its own; the evidence that the adapter learned the RIGHT thing is the layout measurement, not this curve. Gradient norm is non-zero at every one of the 3000 steps (median 0.0150, minimum 0.0032), which rules out the 'adapter does nothing' failure mode. Peak VRAM is 6.86 GB of 40, so the run was encoder-bound, not memory-bound.
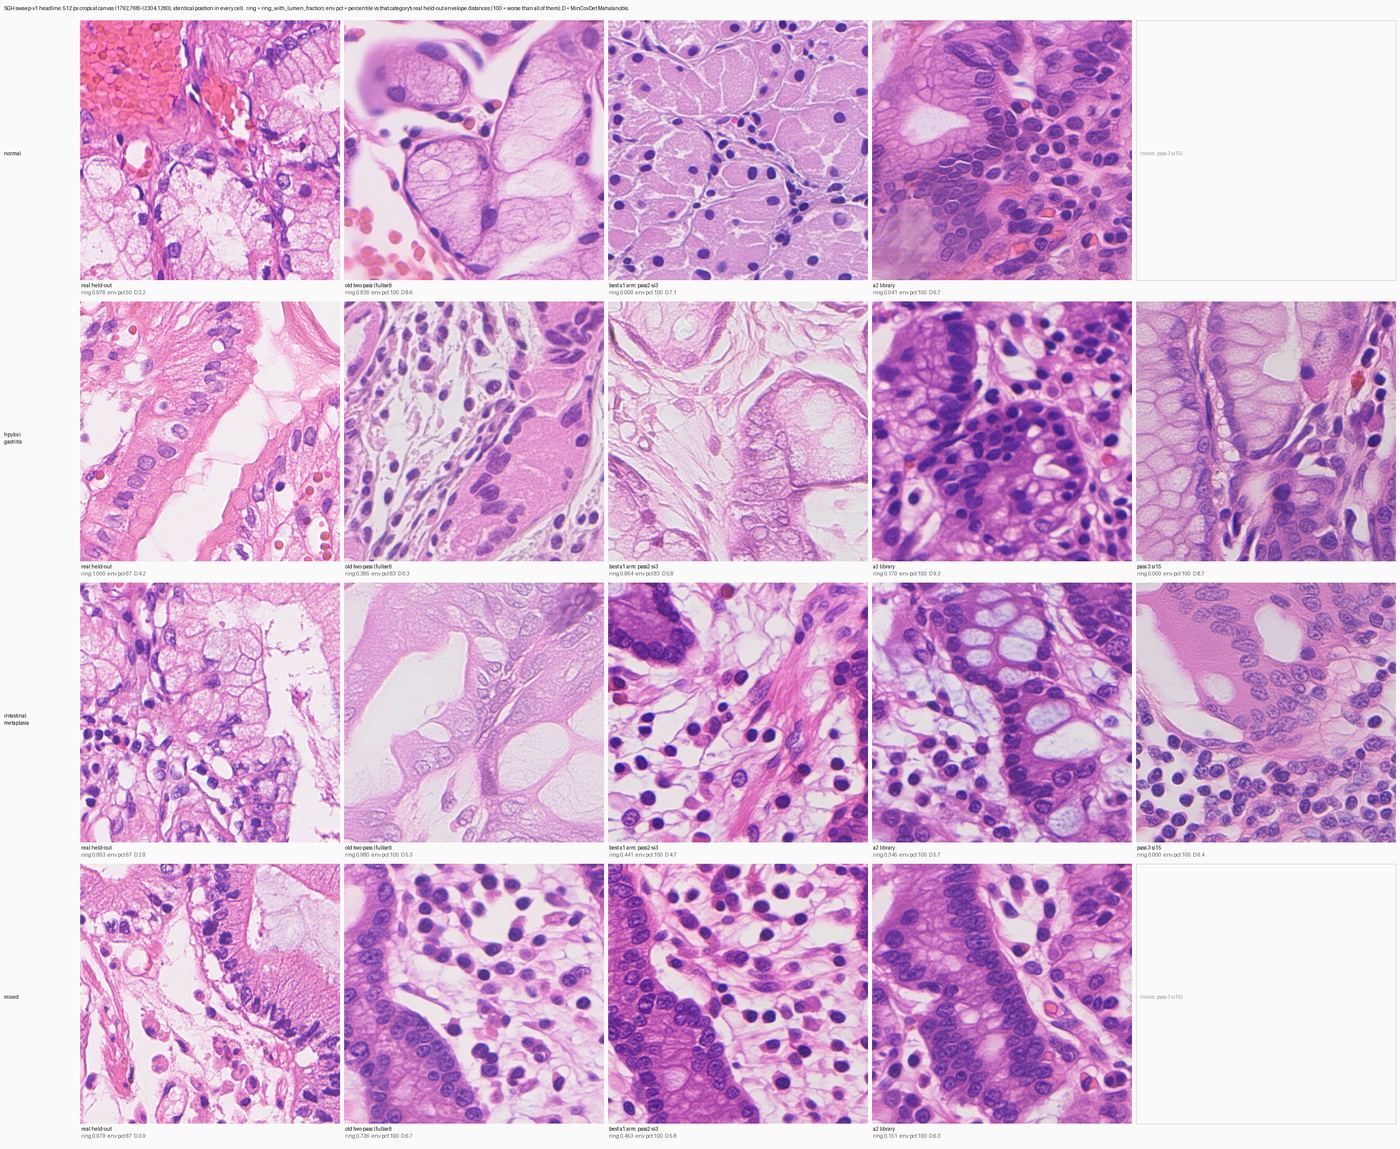
Sweep v1 headline: every category, real tissue against the old baseline and today's arms
Four rows, one per category. Five columns: real held-out | the old two-pass baseline (pixcell-fullset-20260908) | the best a1 arm today (pass 2 at start_index 3) | a2, the composition-matched token library | pass 3 at start_index 15. Every cell is the identical 512 px window at canvas (1792, 768)-(2304, 1280), labelled with ring, env pct and D. Cells marked 'none' had no output for that category. Column 3 against column 2 is the headline comparison: today's best arm is closer to real on the envelope in all four categories (D 7.10 / 5.77 / 4.67 / 5.78 against 8.64 / 6.32 / 5.28 / 6.74) and visibly crisper. Column 1 is the reference - note that the real cells are more ORGANISED than any generated cell: one or two large glands with an open lumen and a regular basal palisade, where the generated fields show many small irregular lumina and less orderly nuclear rows.
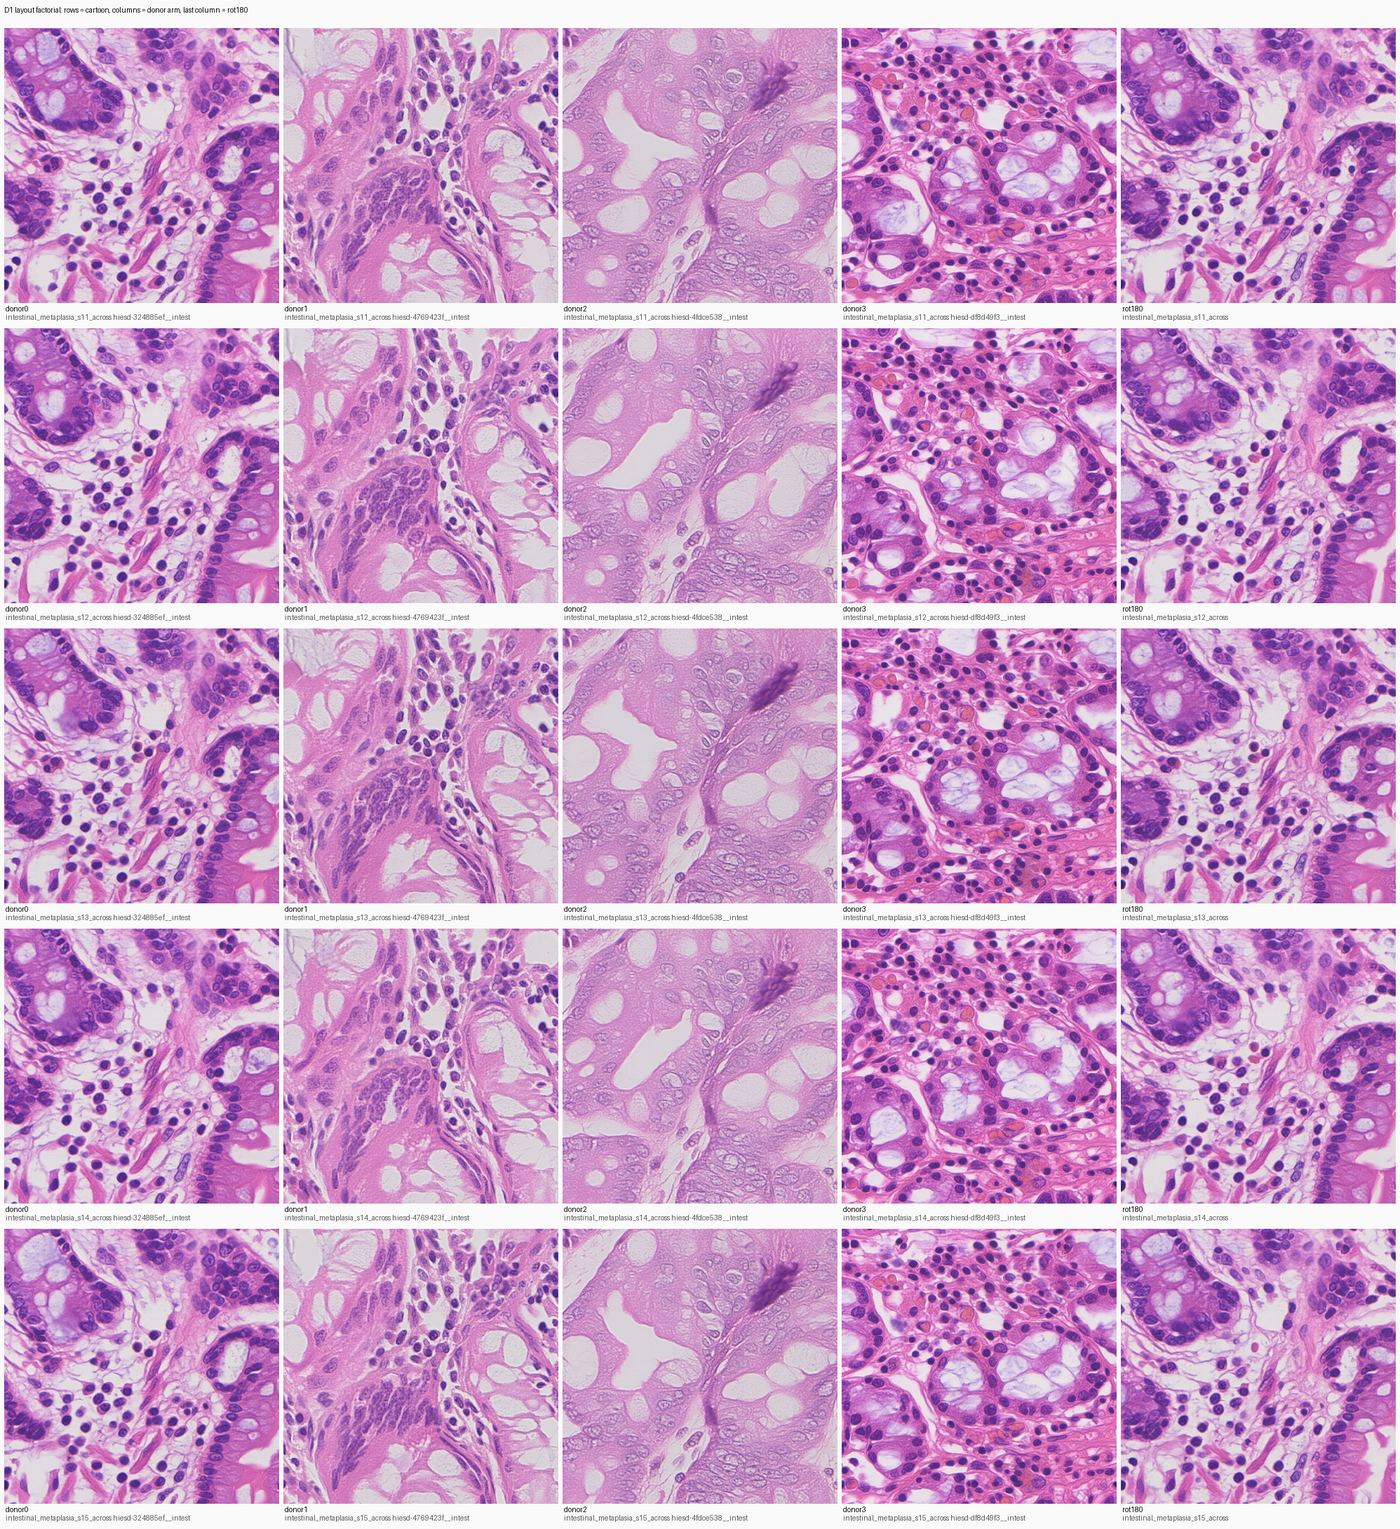
D1 layout factorial: five cartoons against four donors, at pass 2
Rows = five different cartoons. Columns = four different real donor fields, with a fifth column showing the rot180 arm (the same cartoon rotated 180 degrees, donor 0). All cells are pass 2 at start_index 6, the same 768 px canvas window. Read DOWN a column: same donor, five different drawings, and the five images are near-copies of each other - the donor2 column is the same pale mauve field with the same dark diagonal streak in the upper right, five times. Now read ACROSS a row: same drawing, four different donors, and the four images have nothing in common. That is the central refutation of the day: at pass 2 the donor sets the layout, not the cartoon. The measurement is SSIM 0.870 down a column against 0.505 across a row; at pass 1 the relationship is exactly reversed (0.874 across, 0.301 down).
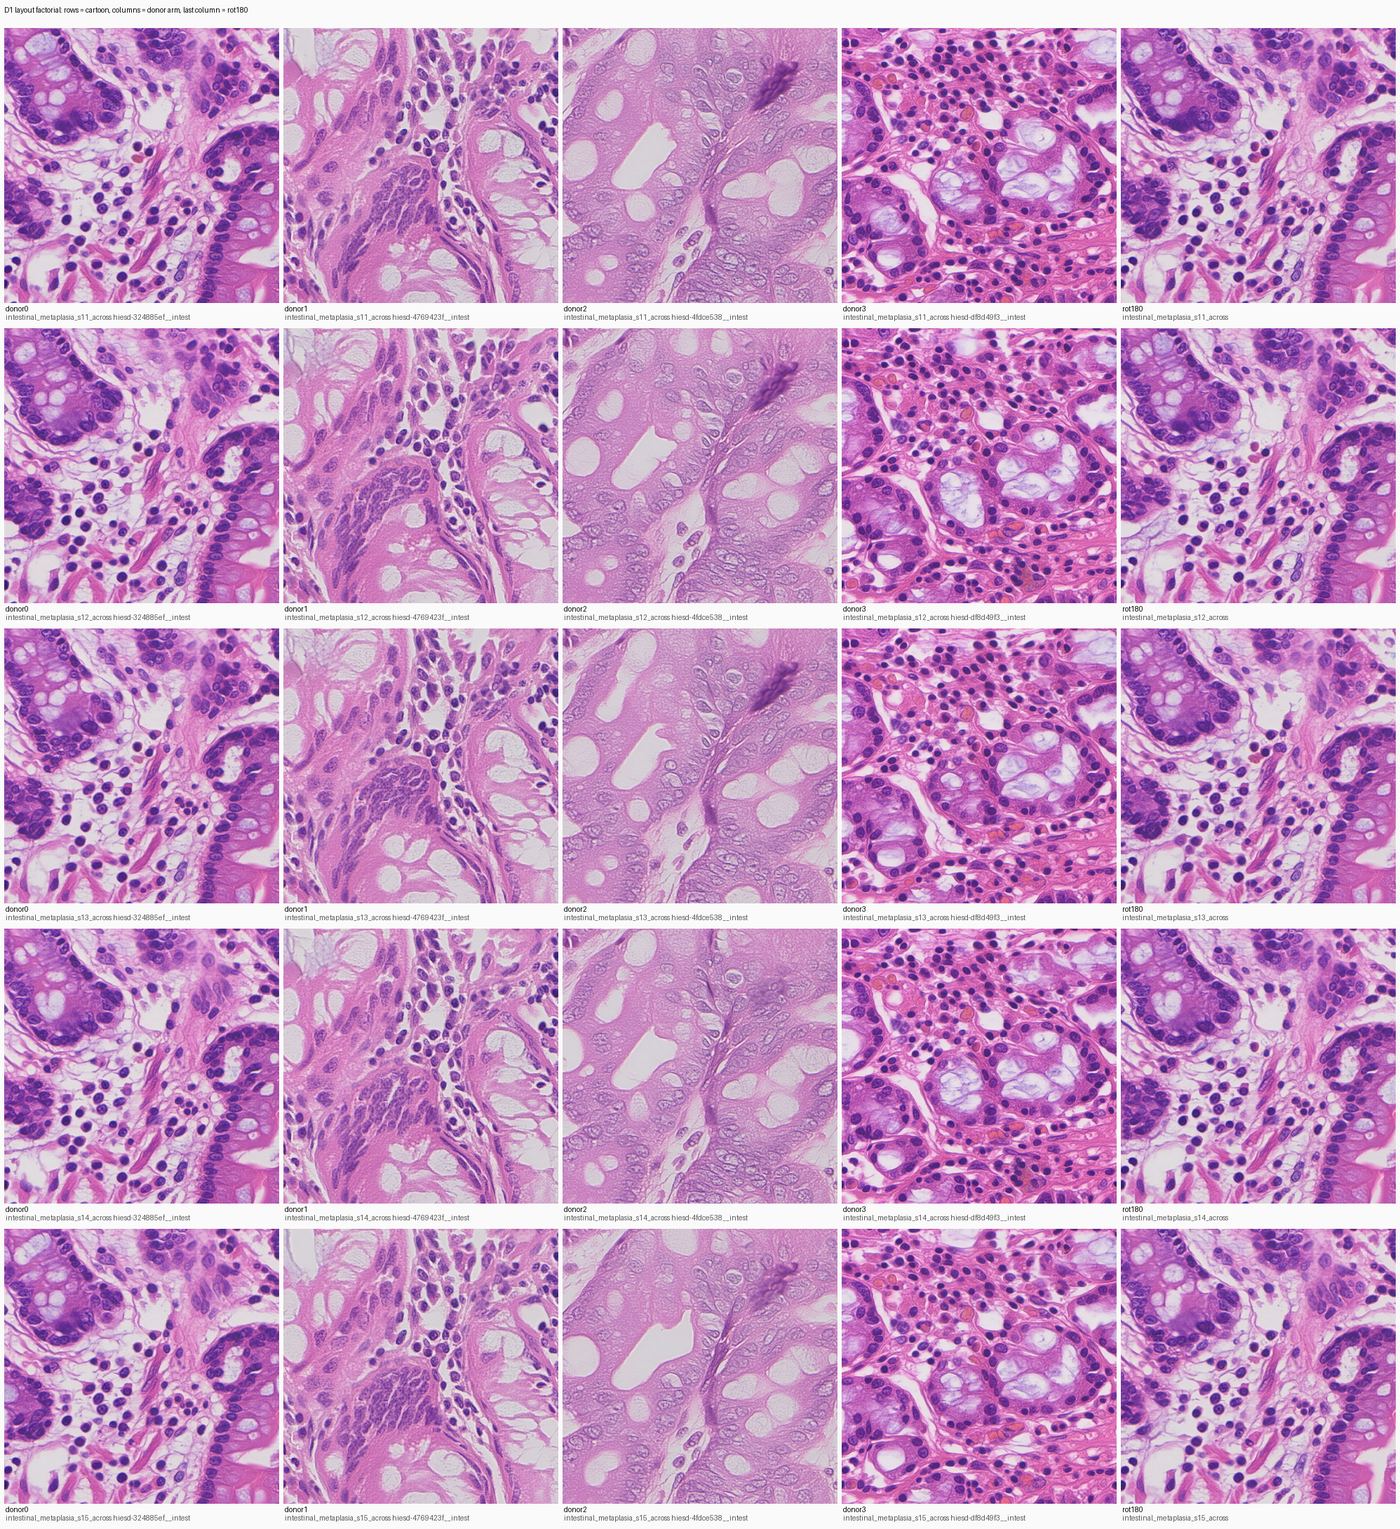
The same factorial on the v2 cartoons - the effect is stronger in both directions
Same construction as the v1 sheet: rows = five d1v2 cartoons, columns = four donors, last column = rot180. The v1 conclusion reproduces exactly and sharpens. At pass 1 the cartoon reaches 92% of the highest overlap this measurement can give (v1: 87%), the four donor arms are flat to 0.036, and a rotated cartoon's output prefers the rotated label map by 30.6x (v1: 10.8x). By pass 2 it has inverted harder: same-donor / different-cartoon SSIM 0.901 against same-cartoon / different-donor 0.511, and the overlap is down to 6% of ceiling.
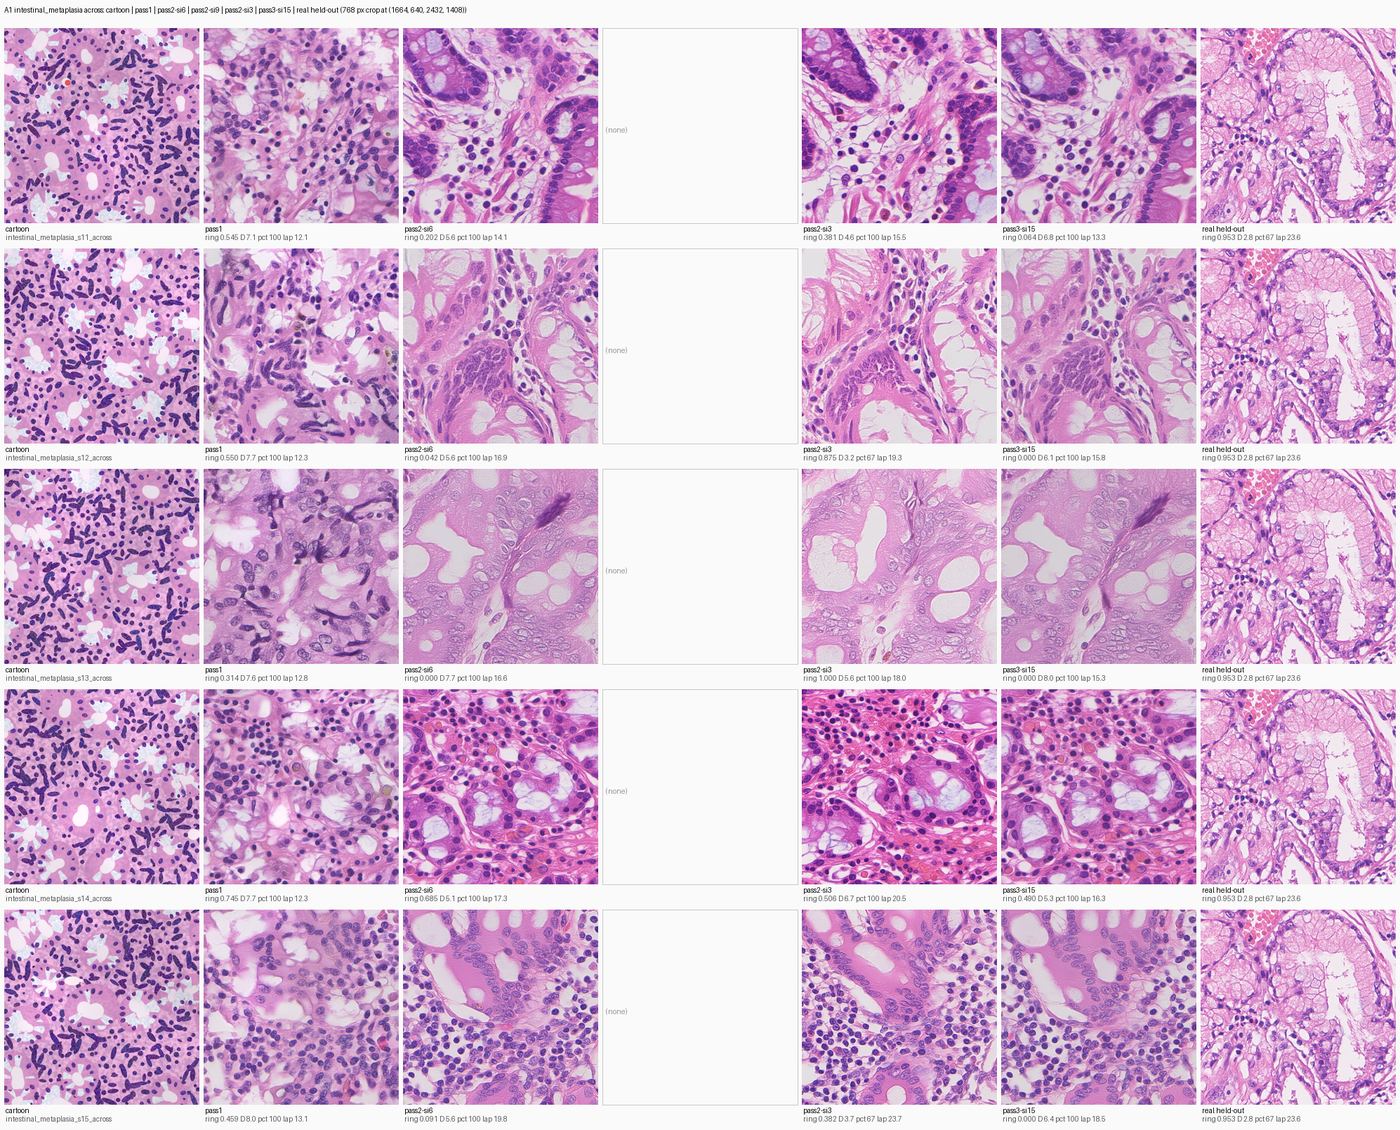
The full repaint-depth ladder for intestinal metaplasia, 'across' cut
Five rows, one per seed (11-15). Seven columns: cartoon | pass 1 | pass 2 si6 | pass 2 si9 | pass 2 si3 | pass 3 si15 | real held-out. Identical 768 px canvas window in every cell. Column 1 is a dense field of small purple ovals on pink with a few white slots - a nuclear scatter, not a gland drawing. Column 2 (pass 1) is a blurred version of exactly that and looks like nothing histological. Columns 3 and 5 are the first that read as gastric mucosa: columnar epithelium, foveolar pits, mucin-filled cells, capillaries with red cells. Column 7 is real tissue and is visibly more organised than any of them.
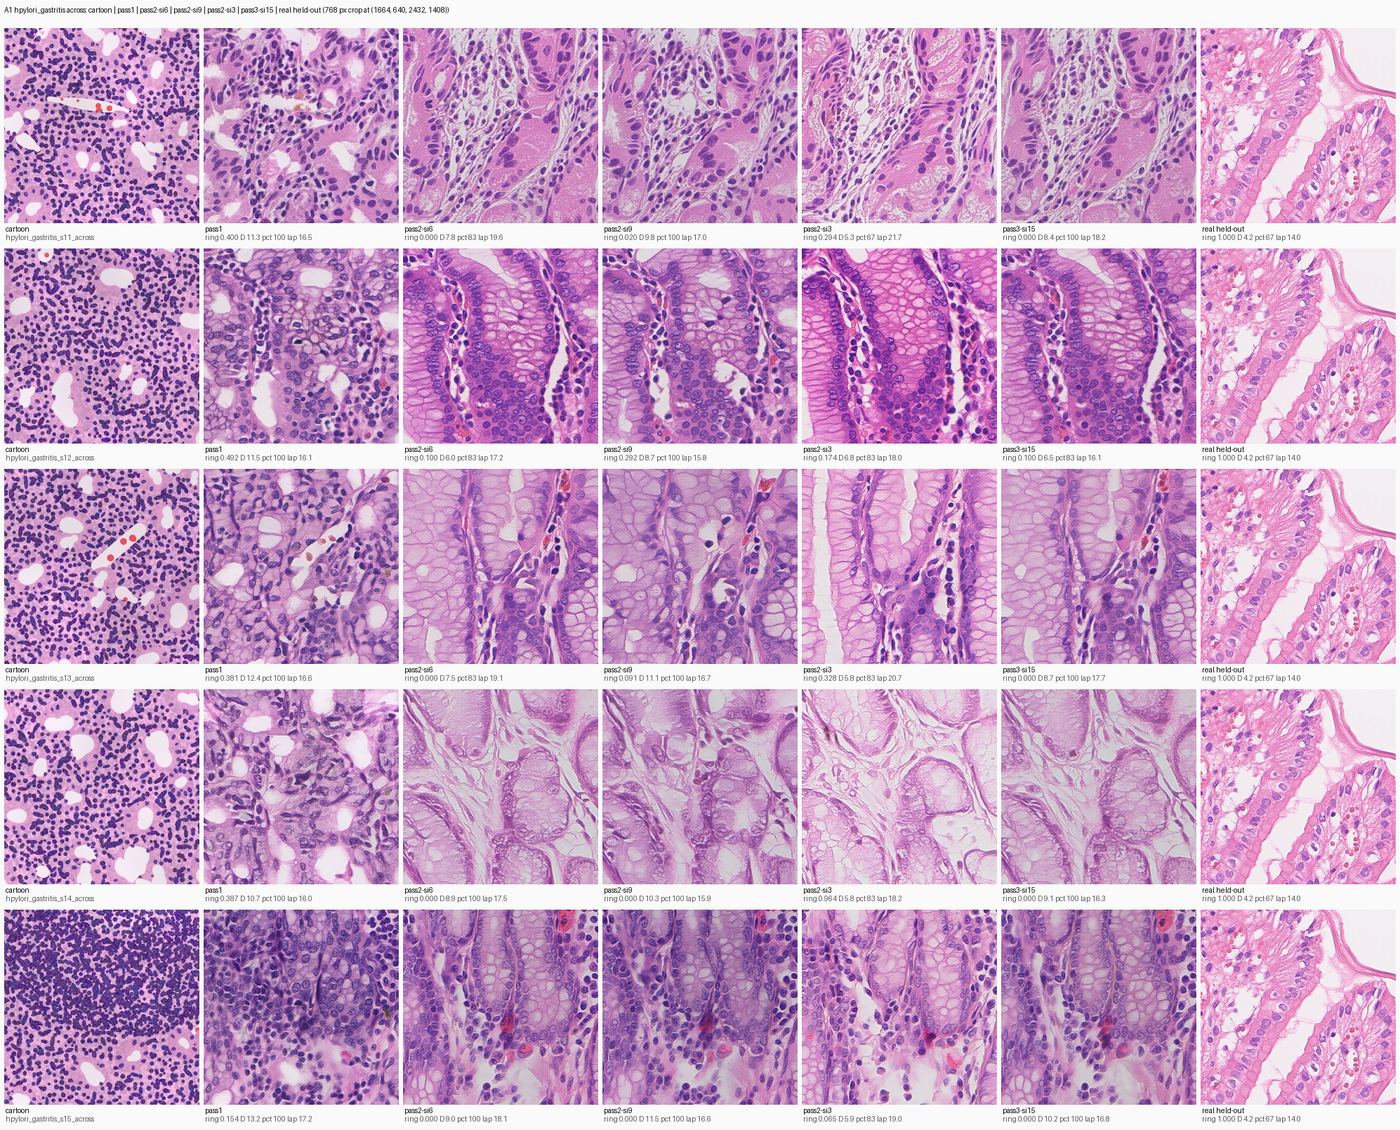
The same ladder for gastritis - the category where the second pass does the most damage
Five rows (seeds 11-15), seven columns: cartoon | pass 1 | pass 2 si6 | pass 2 si9 | pass 2 si3 | pass 3 si15 | real held-out. Track the pale enclosed spaces across the row. The ring measure goes 0.371 after pass 1 to 0.062 at si6 - the gland openings close up. si9, the arm added specifically to rescue this, is no better (0.110) and is worse on the realism measure. Only si3 recovers part of it (0.394). Also look at how little inflammatory infiltrate is in the connective tissue compared with the real column: stromal nuclear density is about 1280 per mm2 in these images against a real 4588.
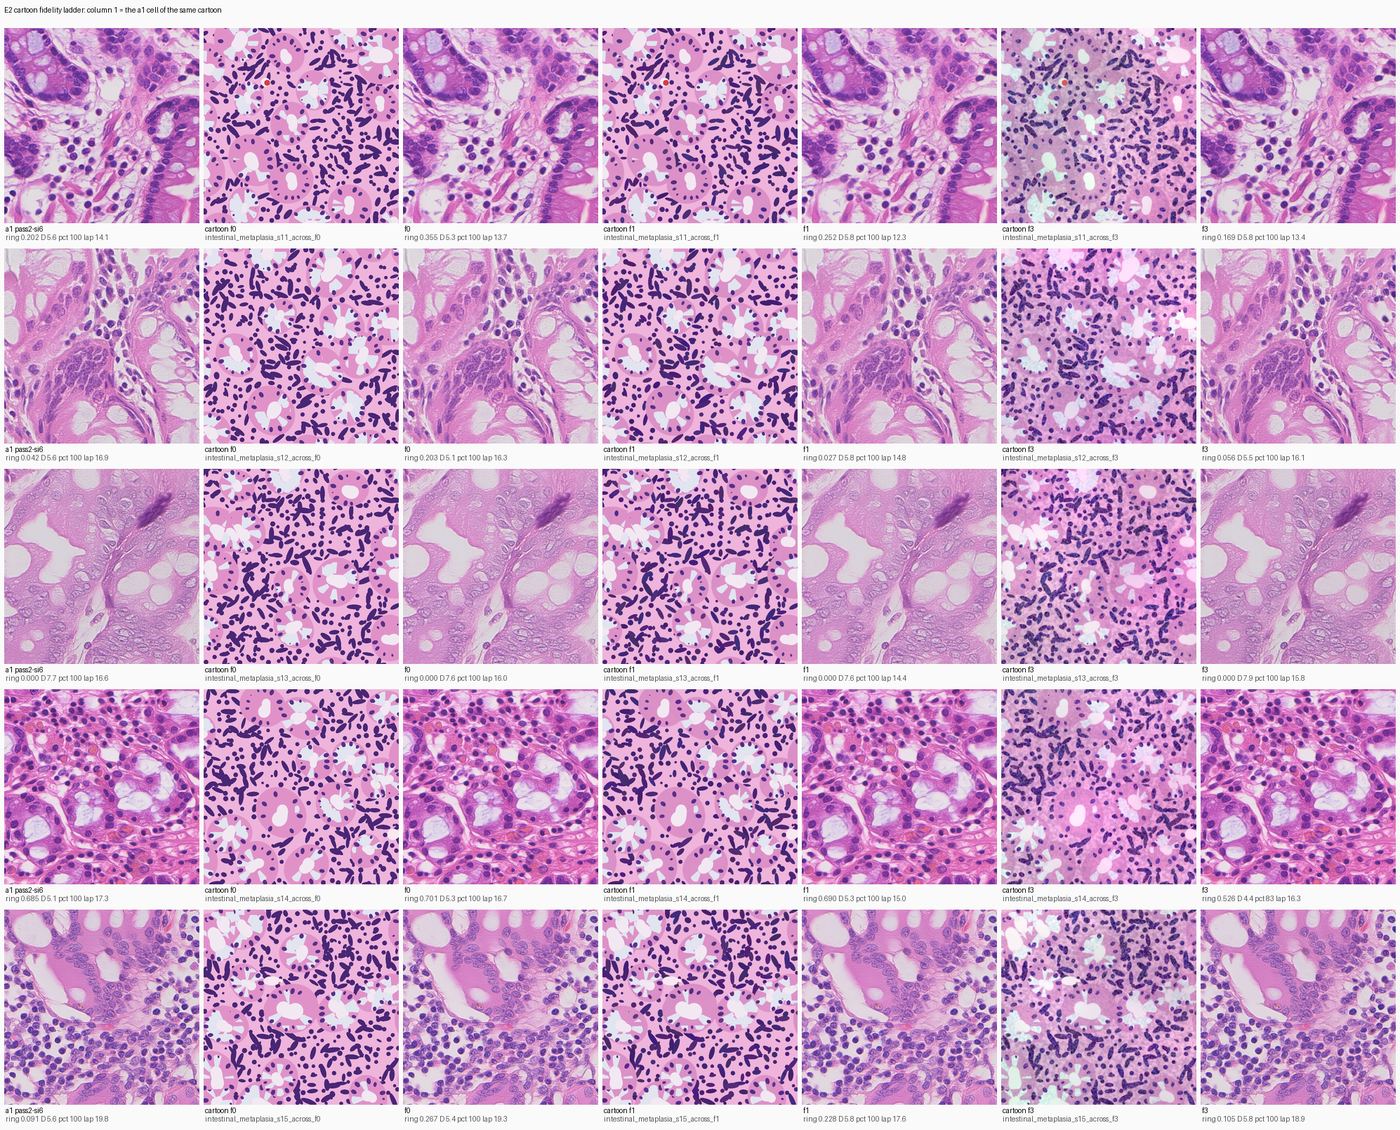
E2 cartoon fidelity ladder: four drawings, four indistinguishable outputs
Five rows, one per seed. Columns interleave each fidelity rung's cartoon with the canvas it produced: f0 (flat label colours, no texture, no blur) | its output | f1 (+ basement rim, per-nucleus jitter) | its output | f2 (the shipped renderer, = the a1 cell of the same seed) | its output | f3 (+ simulated optics, chromatin grain, stain drift) | its output. The four cartoons in a row are visibly different. The four generated outputs in the same row are visibly the SAME image - one row even carries the same dark diagonal streak in all four. The envelope distance spread across the whole ladder is 0.51 D on n = 5 per rung, smaller than the spread within a rung. If anything the crudest drawing does marginally best, and it is the cheapest to render. Cartoon photorealism is not a lever on this pipeline.
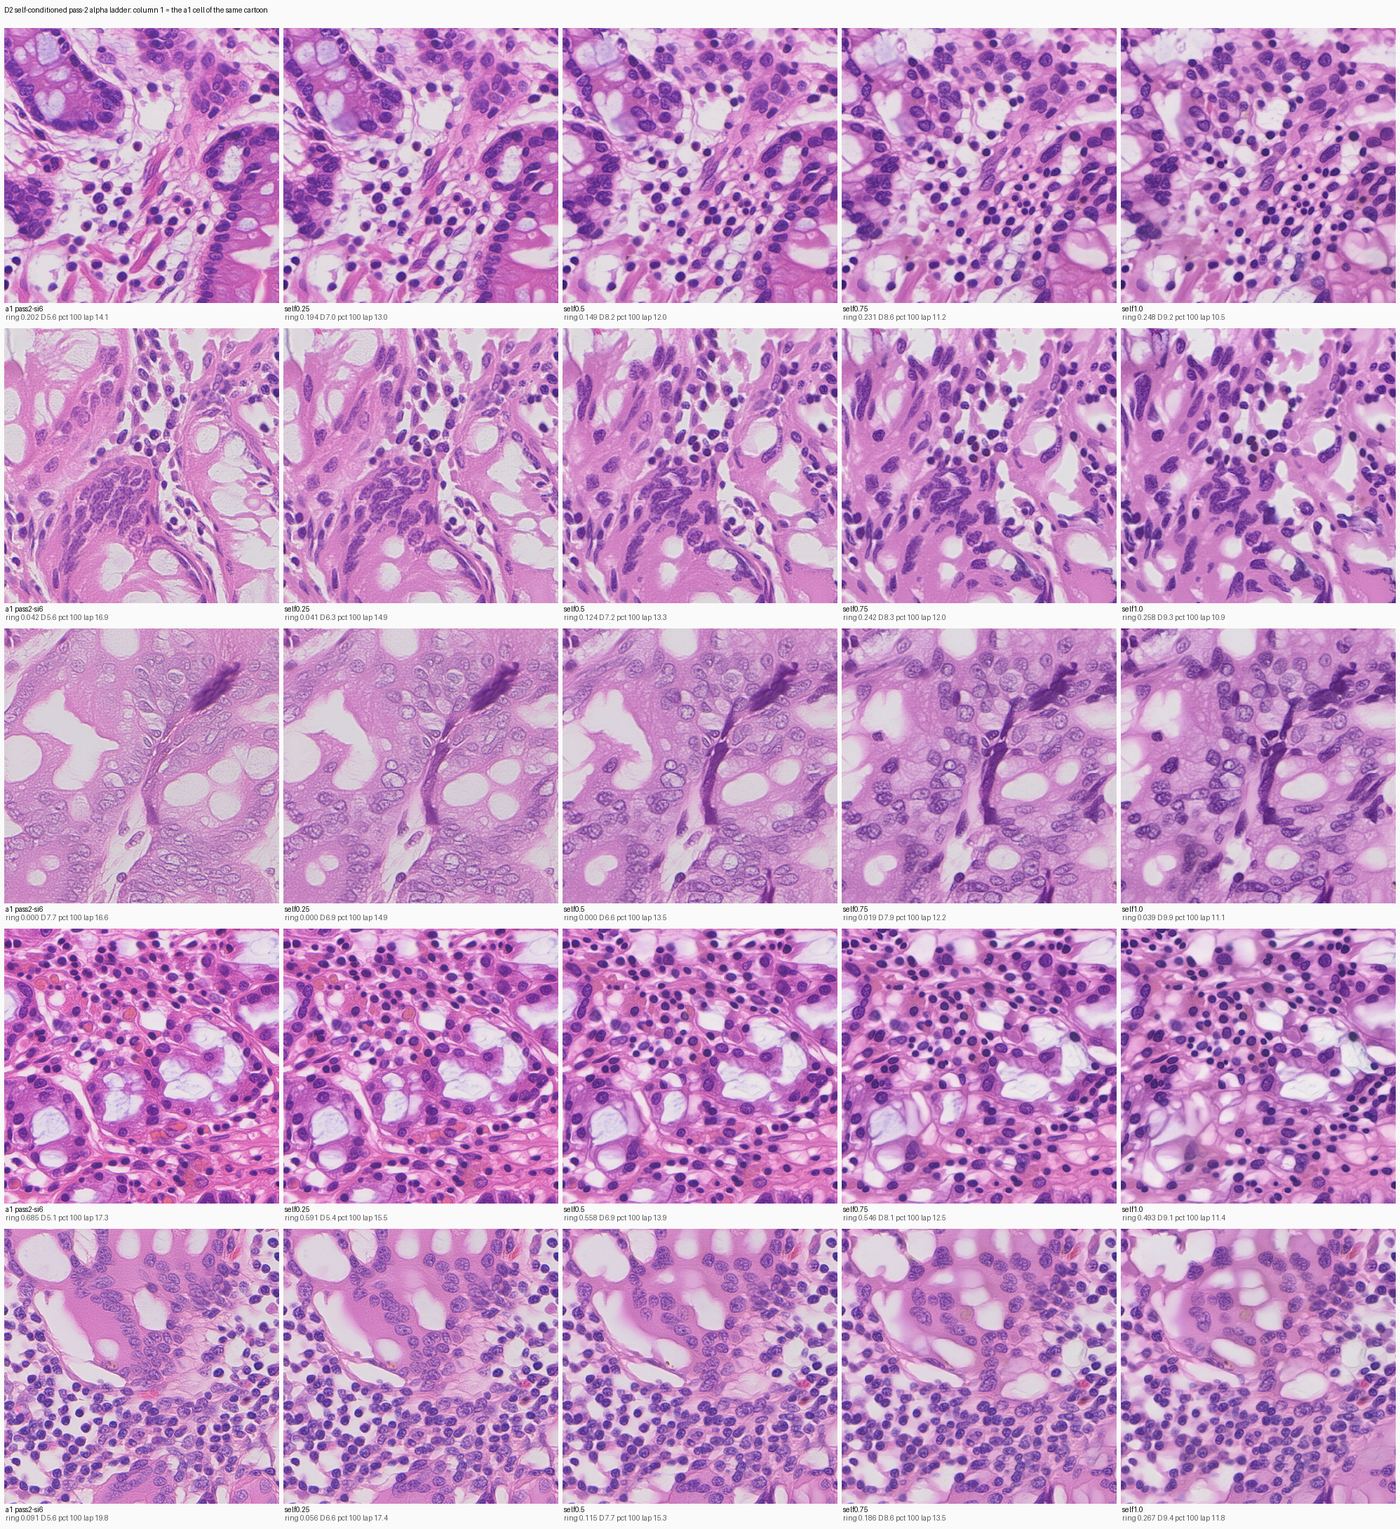
D2 self-conditioned pass 2: removing the real donor, alpha 0 to 1
Rows = five IM 'across' cartoons. Columns = alpha 0 (the a1 si6 cell, full real donor) | 0.25 | 0.5 | 0.75 | 1.0 (no real donor at pass 2 at all). A clean visual gradient left to right: the same structures stay in the same places while the rendering gets progressively smoother and flatter, until at alpha 1 the nuclei are uniform featureless ovals in a flat cytoplasm. Every measurement is monotone: from alpha 0 to 1 the envelope distance rises 67% and the fine-detail statistic falls 35%. What alpha 1 buys is provenance - tiles landing on their own donor fall from 0.867 to 0.025 and the copy margin becomes the largest in the sweep - so this is the trade, not a free win.
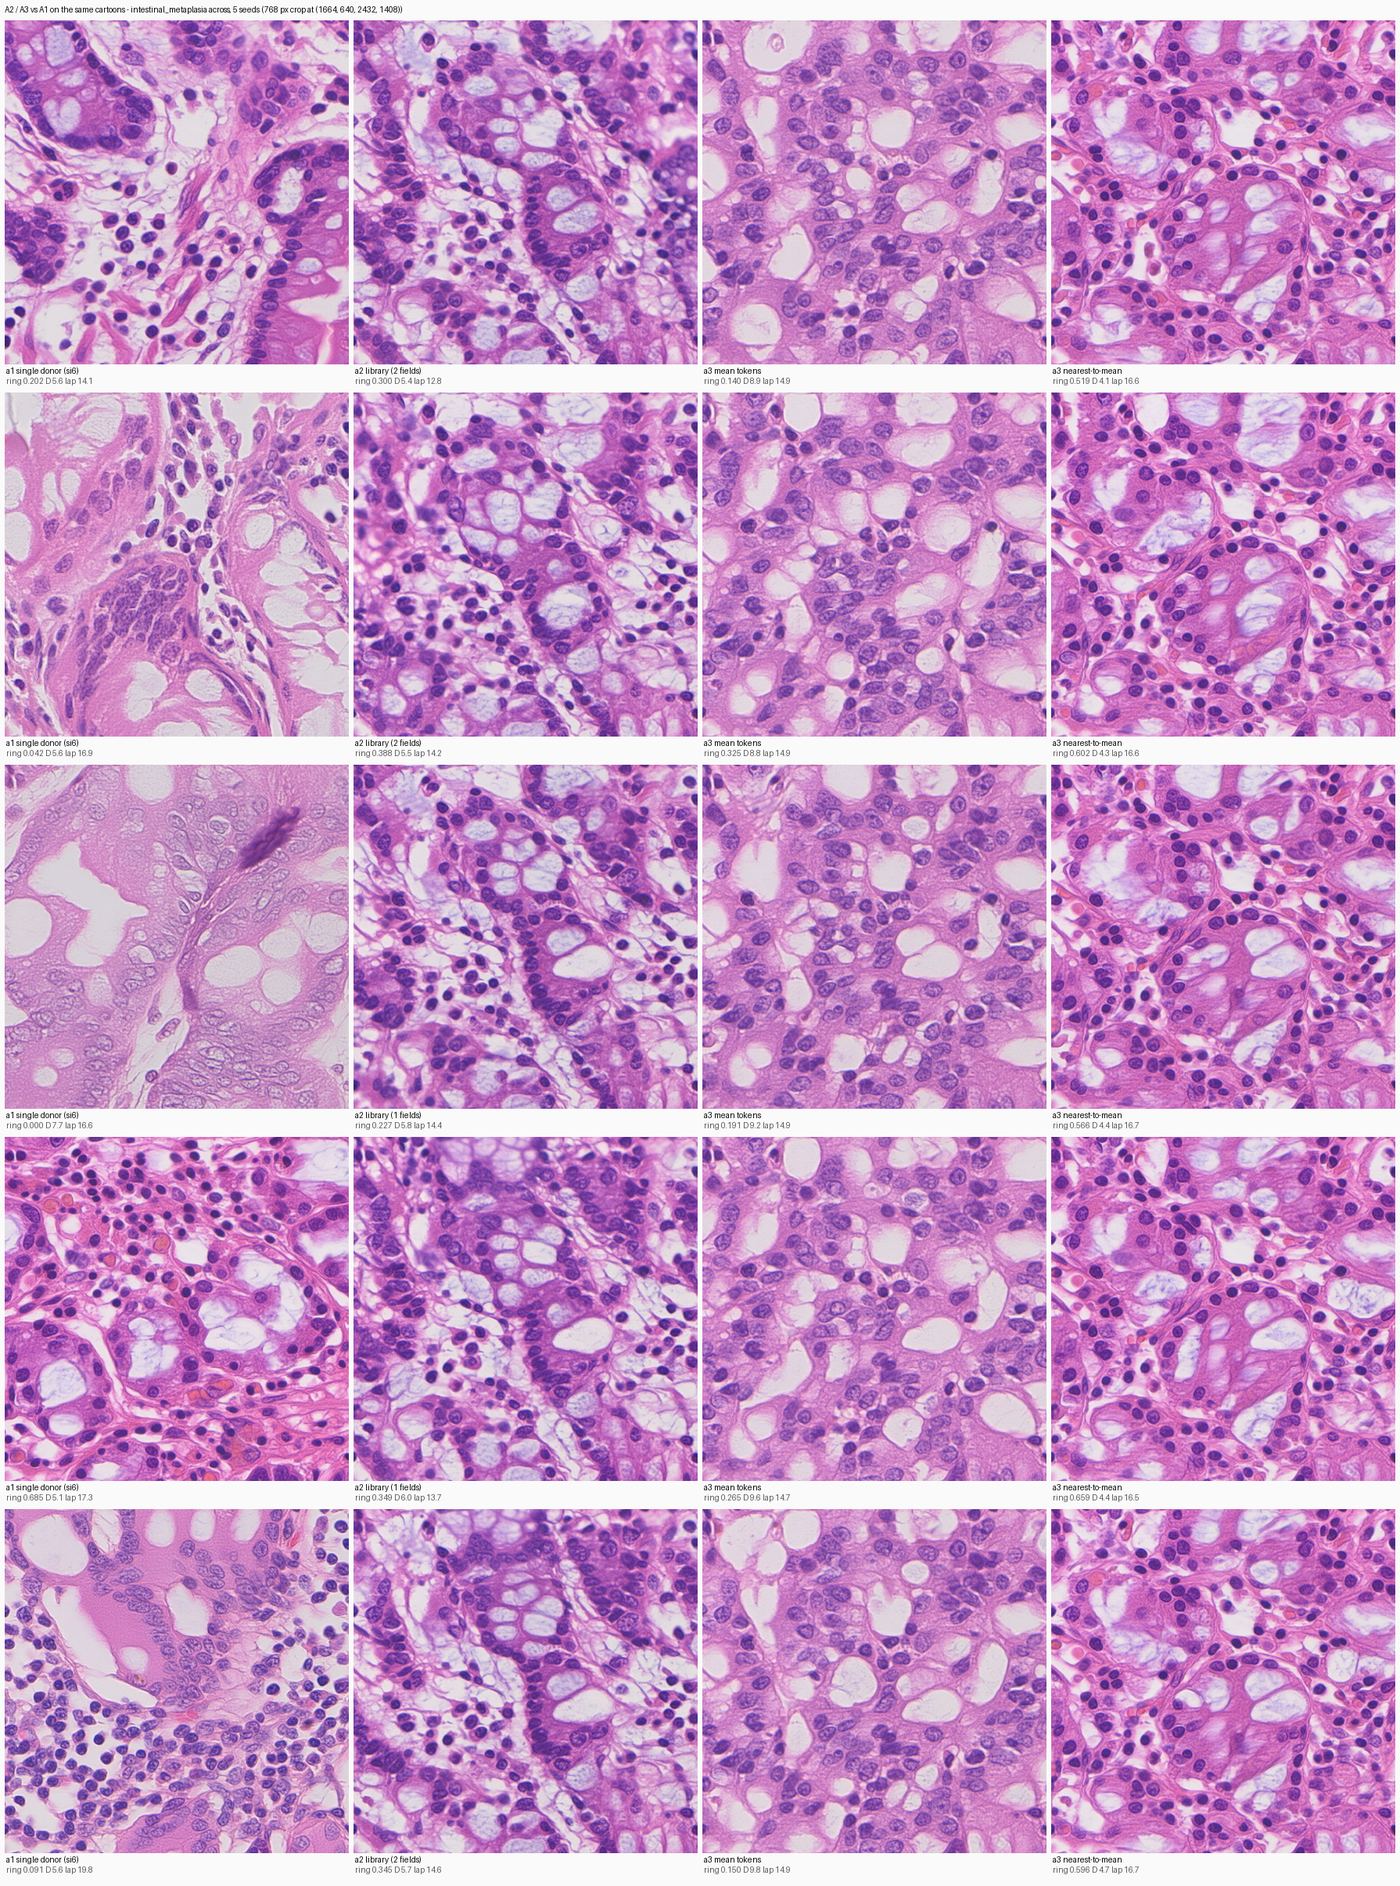
A2 token library and A3 mean tokens against the single-donor arm, intestinal metaplasia
Rows = five 'across' seeds. Columns compare A2 and A3 against the a1 cell on the same cartoon: the a1 single-donor arm | a2 composition-matched library | a3 grand-mean tokens | a3 nearest-to-mean tokens. Identical 768 px canvas window. Read down each column. The a3 'mean' column is the same pale, low-contrast field of loosely-packed cells with evenly-sized round nuclei in every row: no gland, no lumen, no palisade, no goblet cell, no vessel - a cell suspension, not tissue. The a3 'nearmean' column is the opposite: coherent, with clusters of clear goblet-like vacuoles between nuclear strands, and it is the best-scoring intestinal metaplasia in the whole sweep. But its five images have pairwise SSIM 0.877 - it is one image generated five times from five cartoons that had no effect. The a2 column is also visibly repetitive (SSIM 0.788) where the a1 column is five different fields (0.503).
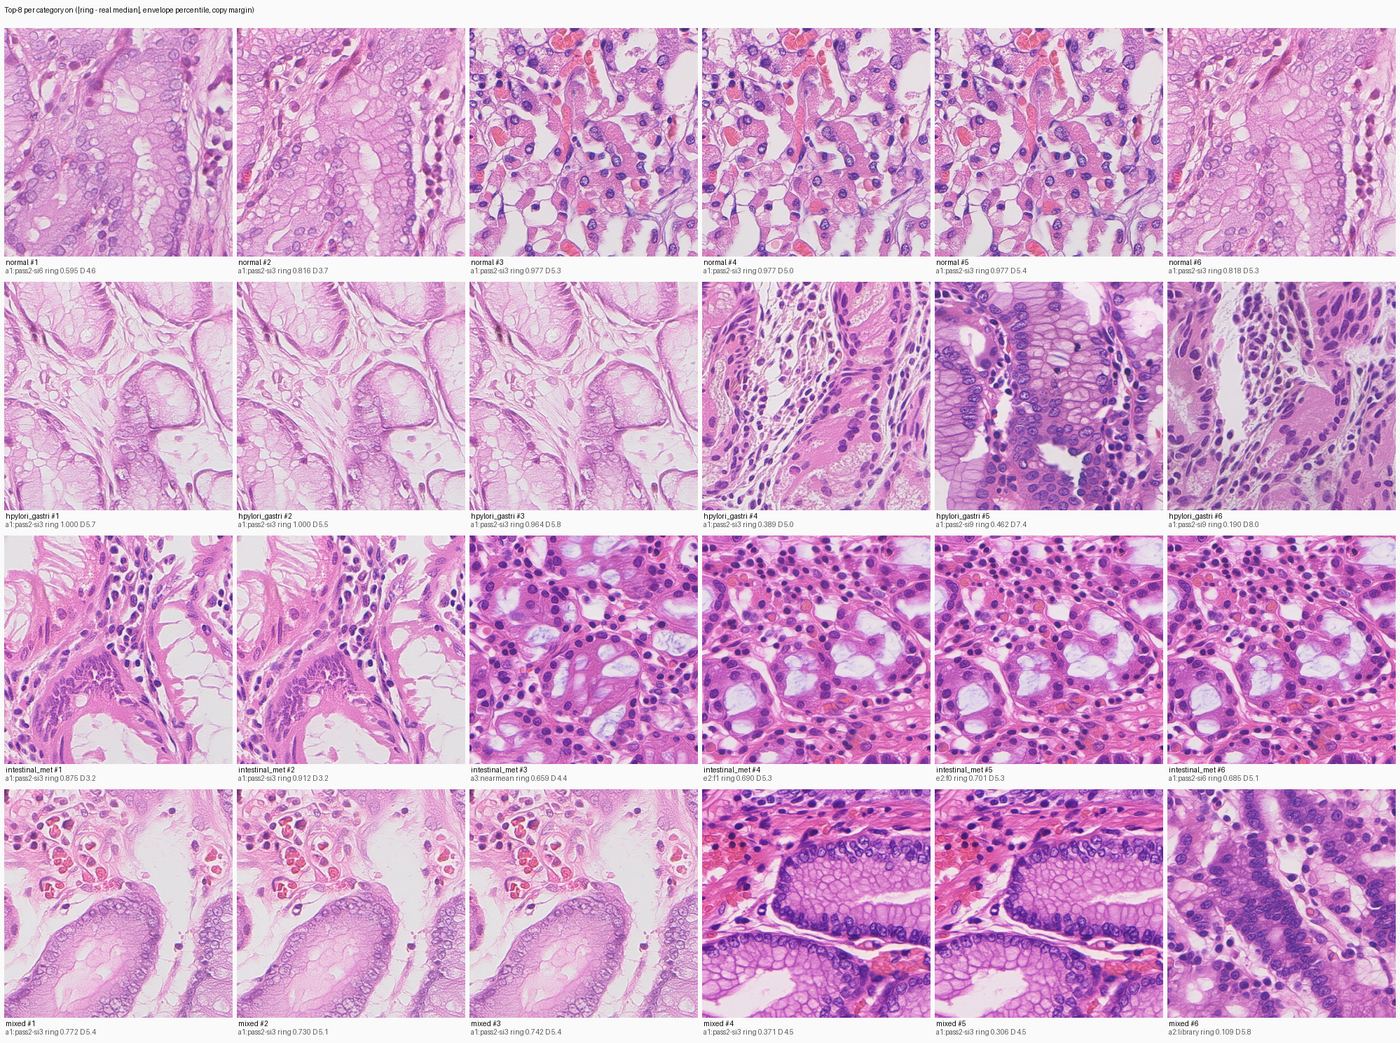
The Pareto top-8 per category
Four rows, one per category. Eight columns, rank 1 to 8, selected on (|ring - real held-out median|, envelope distance, copy margin). Identical 768 px canvas window in every cell. Two structural faults in the list itself. Intestinal metaplasia ranks 6 and 7 are BYTE-IDENTICAL - the same file under two arm names - and gastritis rank 8 is a visibly broken b1 canvas at D 11.32 that is on the front only because its copy margin is the best in the category. Beyond that: gastritis ranks 1-3 achieve a near-perfect ring number by being a washed-out hypocellular honeycomb (27-29 rings against a real 43.5, pale fraction 0.354 against a real 0.229), which is the selection objective being gamed. The normal row shows scattered cells with bright red-orange globules rather than the parallel straight gland profiles of real oxyntic mucosa.
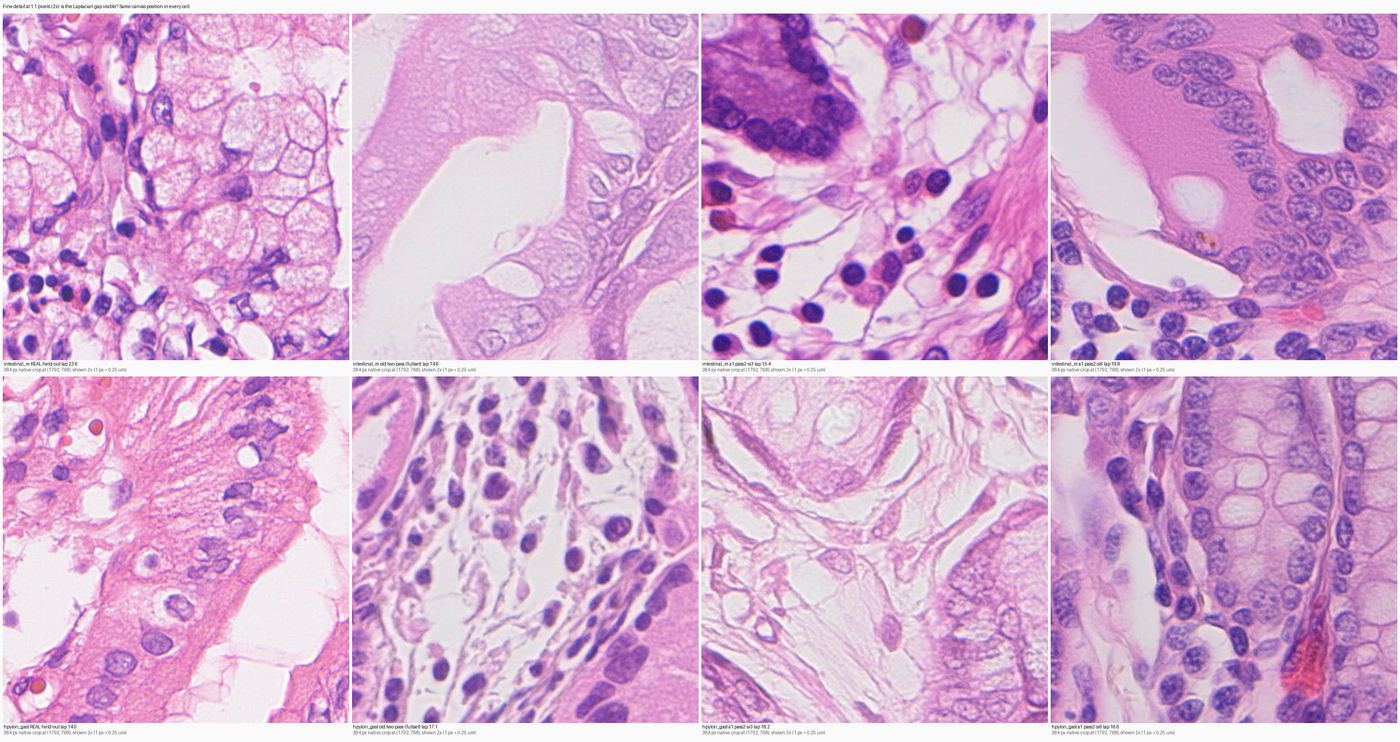
Fine detail at 1:1 pixels: is the Laplacian gap visible?
Two rows: intestinal metaplasia, then gastritis. Four columns: a real held-out field | the old two-pass baseline | today's pass 2 at start_index 3 | today's pass 2 at start_index 6. Each cell is a 384 px native crop at canvas (1792, 768), 1 px = 0.25 um. Each is labelled with its mean absolute Laplacian. Column 2 is a flat watercolour wash with smooth featureless nuclei (Laplacian 14.6). Columns 3 and 4 have markedly more contrast, granular cytoplasm and some intranuclear texture (15.4-19.8). Column 1, real tissue, has speckled chromatin inside the nuclei and visibly granular cytoplasm (23.6). Today's arms close roughly half to two thirds of that gap and are still short of real.
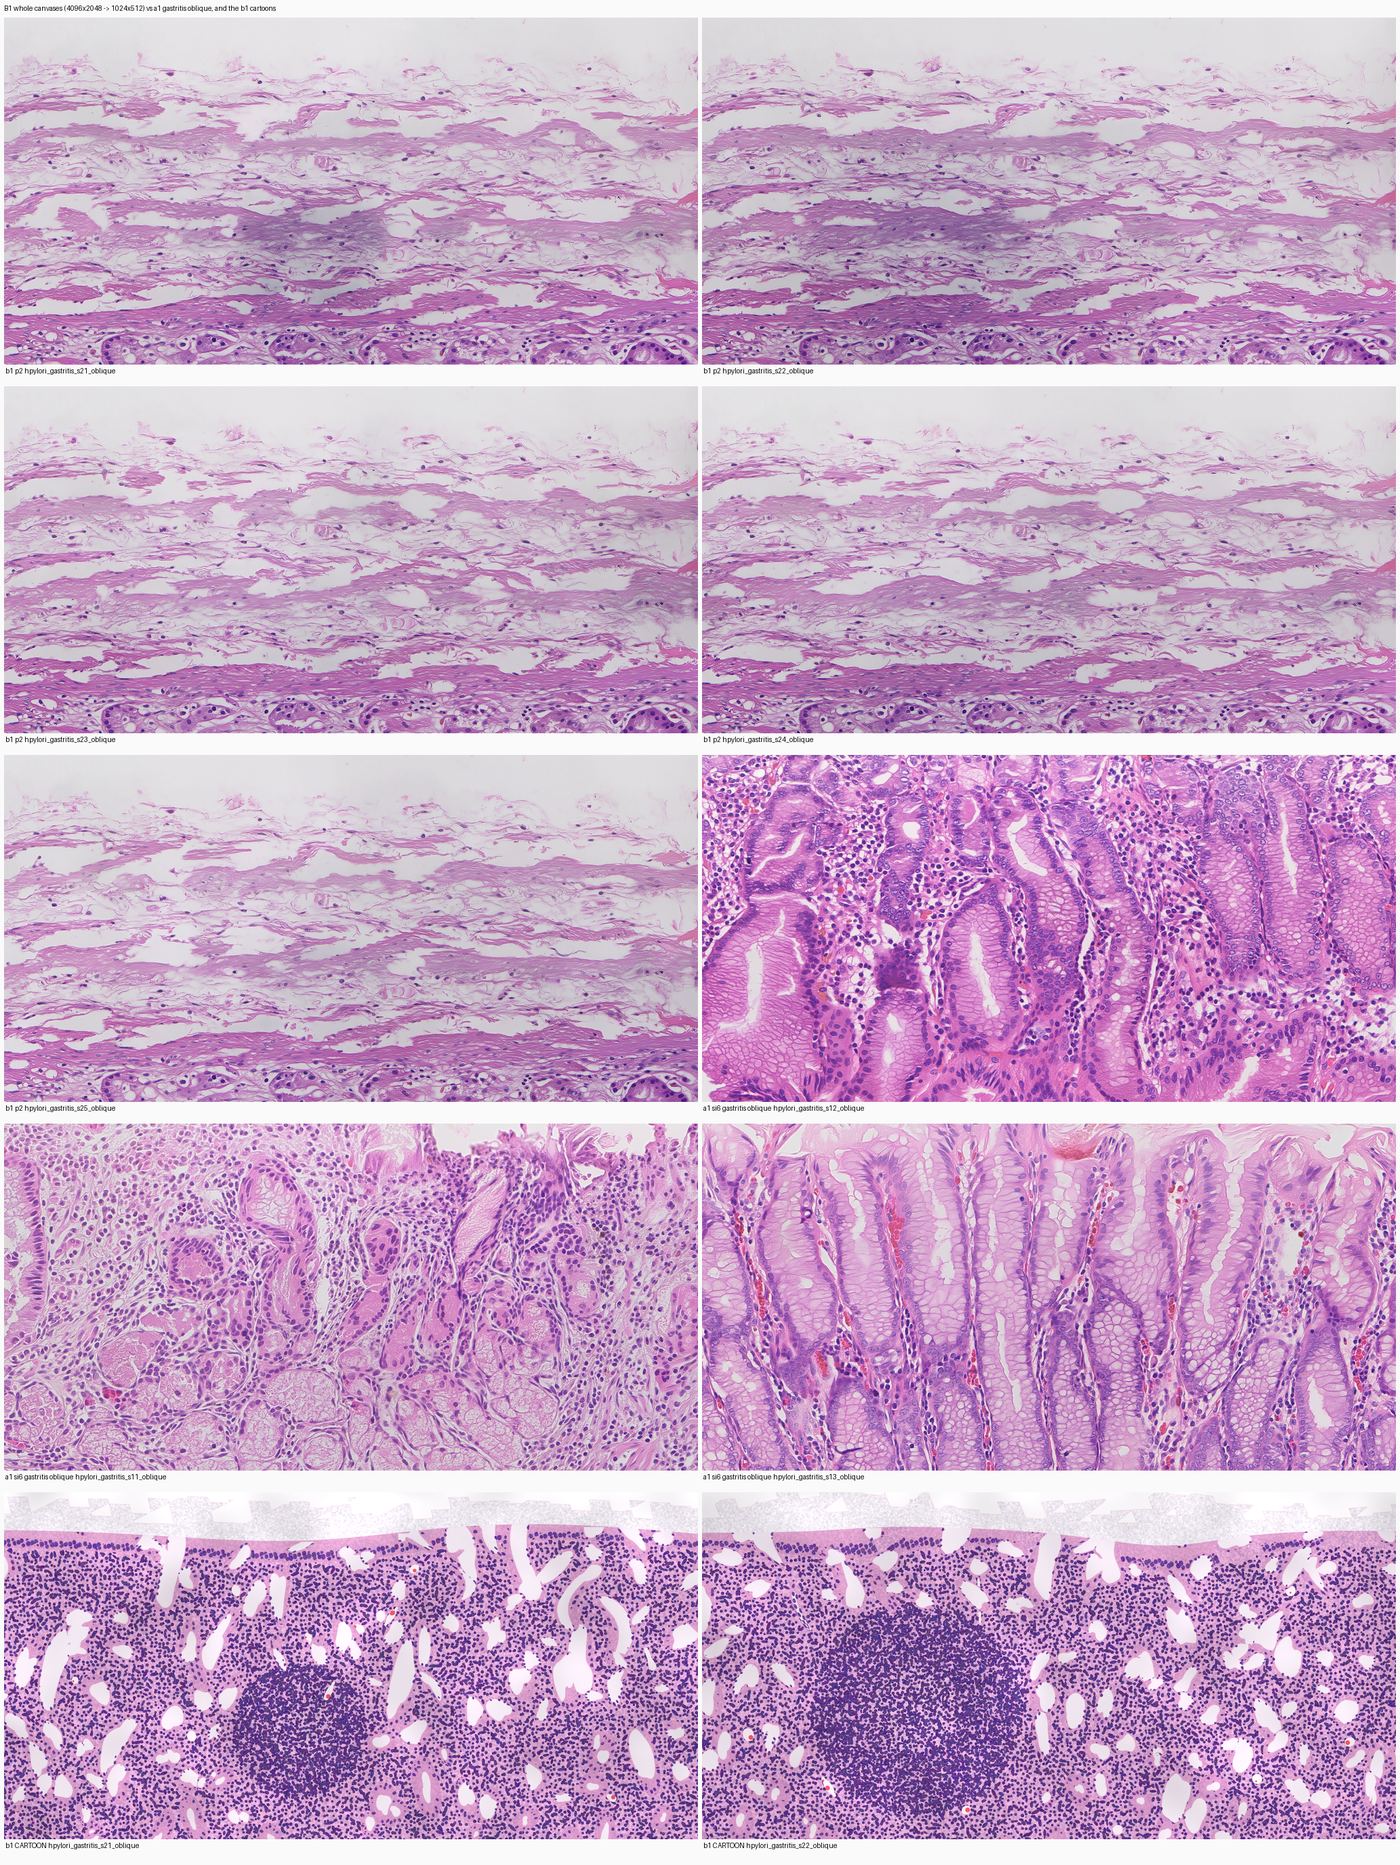
What the gastritis surface-donor arm actually produced - and it is not gastric mucosa
Whole 4096x2048 canvases downscaled to 1024x512: the five b1 pass-2 outputs, then three a1 gastritis 'oblique' canvases for comparison, then two b1 cartoons. The upper 80% of each b1 canvas is a mass of horizontal wispy eosinophilic strands - loose fibrin, mucus strands or shredded collagen - in a nearly empty pale field, with only a thin strip of glandular mucosa along the bottom edge. All five seeds produced the same thing (pairwise SSIM 0.864). The a1 gastritis canvases below show proper foveolar pits, glands, columnar epithelium and lamina propria. The mechanism is the donor-dominance effect: the twelve donor windows are all surface / mucus-interface windows, so conditioning a whole canvas on one of them paints mucus everywhere. This is the worst envelope distance of any arm in the sweep (median D 13.45).
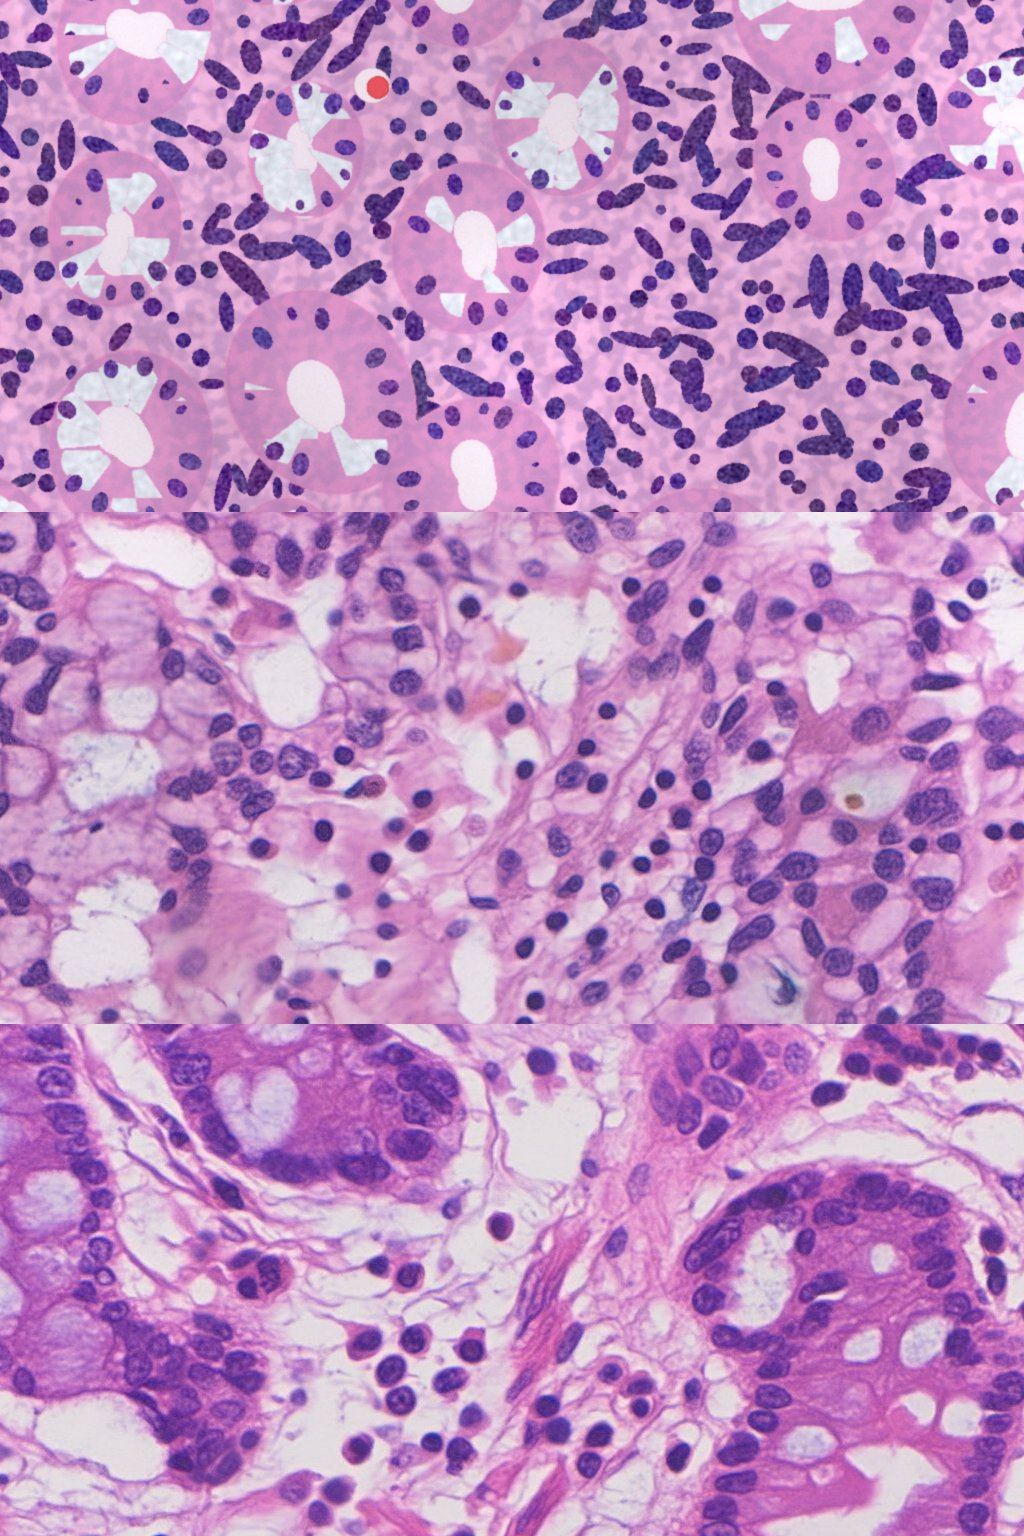
The first sweep output pulled back, and the number that set the rest of the day
Three stacked strips of the same canvas position for intestinal metaplasia, seed 11, 'across': the A1 cartoon (top) | pass 1 at start_index 12 (middle) | pass 2 at start_index 6 (bottom). The top strip is the defect that A1-V2 was written to fix: many small rosettes about 25-35 um across, pit calibre, each fragmented into radial mucin wedges, at 227-252 rings per mm2 against a real p90 of 143-174. Real intestinal metaplasia gland profiles are 74-122 um across. The generator did not read those rosettes as glands, and the ring fraction fell 0.797 -> 0.545 -> 0.202 down the three strips. That single reading, on n = 1, is what triggered the A1-V2 package.
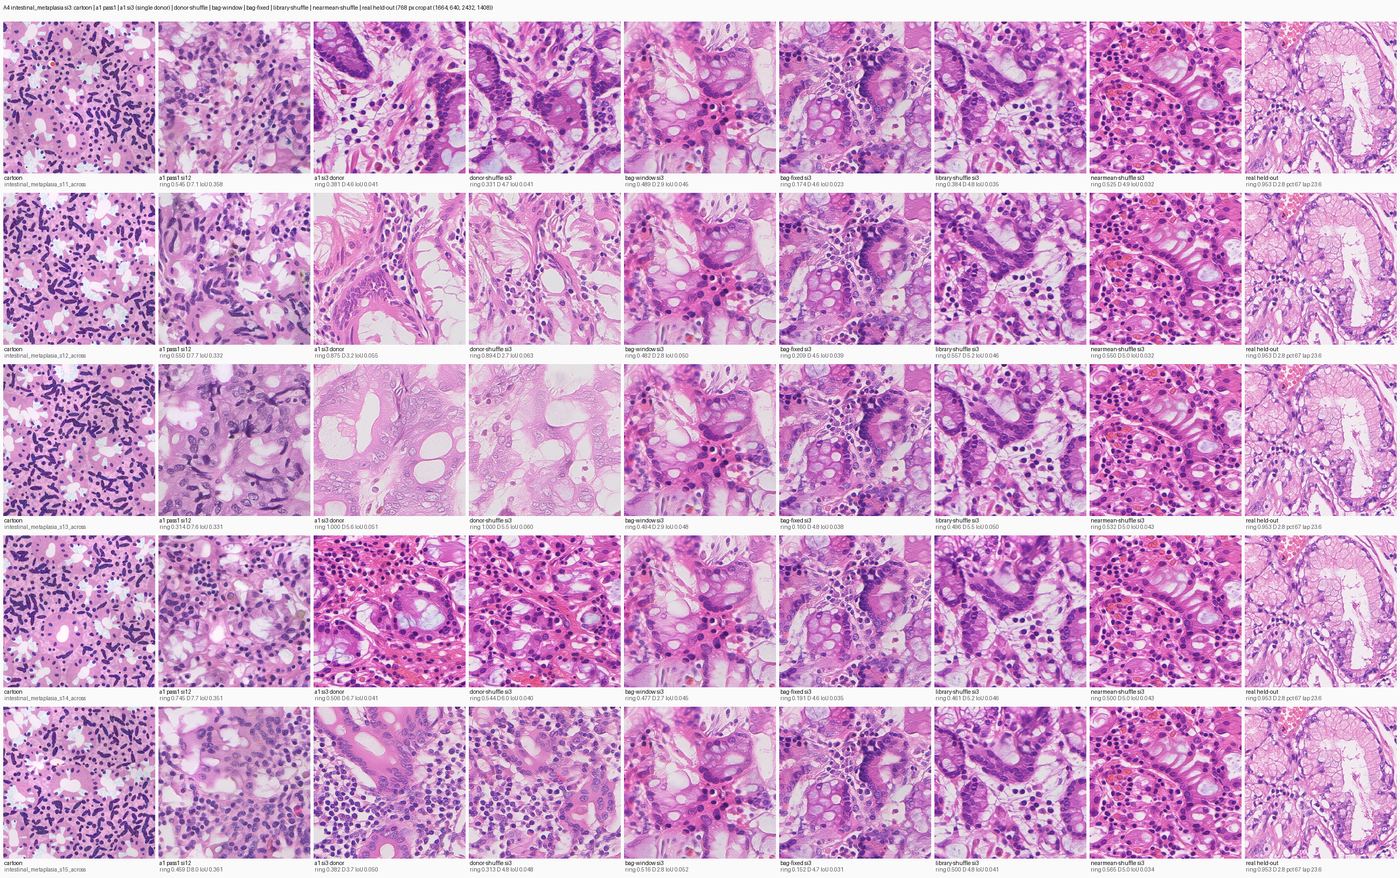
A4 layout-free tokens, intestinal metaplasia - and the repetition they cause
Five rows, cartoons s11-s15. Nine columns: cartoon | a1 pass 1 | a1 si3 (single real donor) | donor-shuffle | bag-window | bag-fixed | library-shuffle | nearmean-shuffle | real held-out. All pass-2 columns are at start_index 3, same 768 px canvas window, each labelled with ring / D / IoU. Read DOWN the columns - that is the decisive view. Columns 2, 3 and 4 are five visibly different fields. Columns 5, 6 and 8 (bag-window, bag-fixed, nearmean-shuffle) are five near-copies of each other: the same pale gland with the same vacuole pattern and the same dark nuclear strand in the same corner, five times. Those three arms seed their tokens on the window index alone, so all five cartoons receive identical tokens and only the start image differs - and the start image turns out to be nearly inert. Column 7 (library-shuffle) is in between. Also note the IoU labels: none of the layout-free arms recovers the cartoon's geometry, all sit at 0.041-0.051 against a ceiling of 0.625.
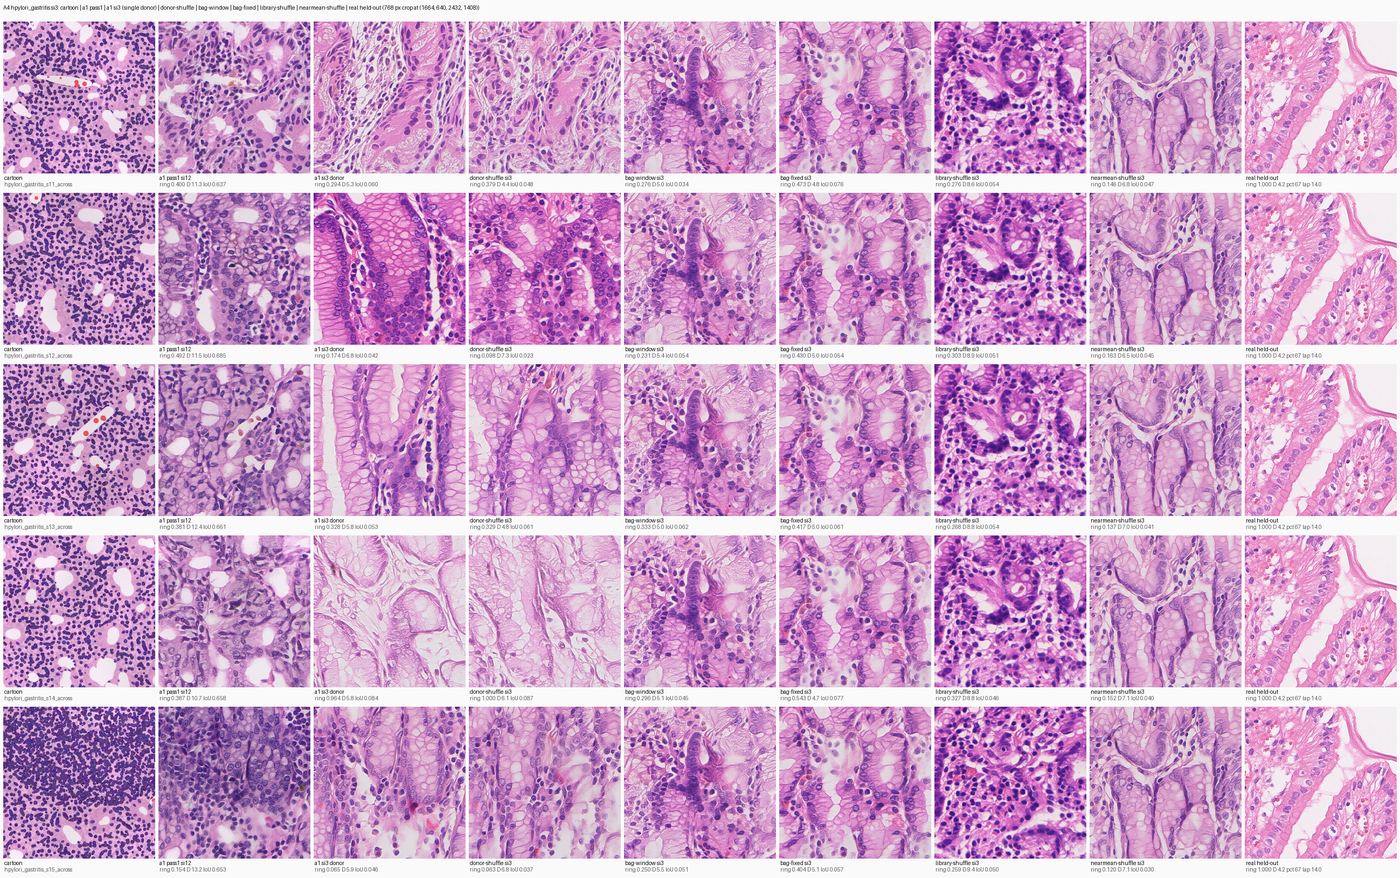
The same A4 comparison for gastritis, where the repetition is starkest
Same nine columns as the IM sheet, cartoons s11-s15. The bag-window, bag-fixed and nearmean-shuffle columns are five copies of one pale foveolar-looking field (pairwise SSIM 0.976-0.986 against a real 0.047). bag-fixed si3 is simultaneously the best gastritis cell in the package on the realism measure (D 4.99, 5 of 5 inside the band) and disqualified by that repetition - which is the whole finding: a token set that does not depend on the drawing gives one image, however good that image scores.
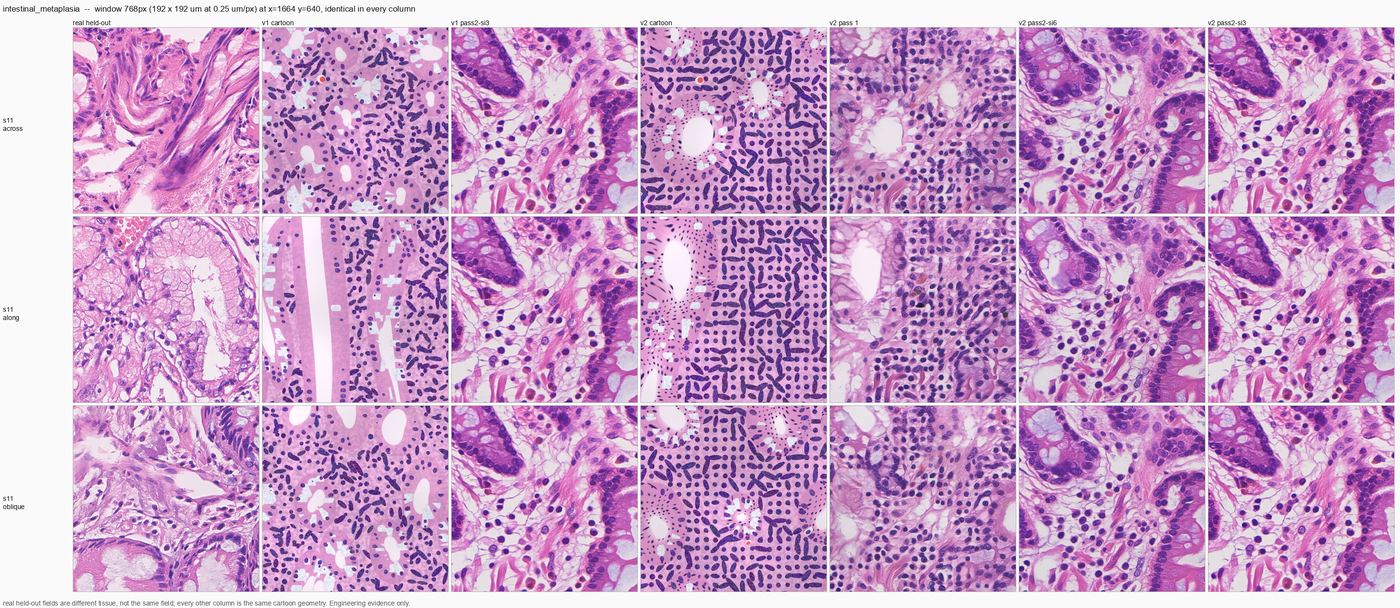
v1 against v2 cartoons and their outputs, intestinal metaplasia
Three rows: seed 11 at the 'across', 'along' and 'oblique' cuts. Seven columns: real held-out | v1 cartoon | v1 pass2-si3 | v2 cartoon | v2 pass 1 | v2 pass2-si6 | v2 pass2-si3. Every cell is the identical 768 px window (192 x 192 um at 0.25 um/px) at x = 1664, y = 640, shown at 384 px. The real cells are different tissue from different slides, not the same field. Column 4 against column 2: the v2 drawing reads as a regular field of dark dots and dashes - that is the 5.8 um chromatin-granule lattice, which exists to make the ring metric seal the gland wall. Column 5 shows what the generator does with it: a sheet of pale polygonal cells with round, uniform, evenly spaced nuclei and almost no chromatin texture - a plausible cell rendering with an implausibly regular arrangement, and no pale enclosed rings for the metric to find. Columns 6 and 7 are the best-looking cells on the sheet: epithelial groups with dark elongated nuclei carrying visible internal chromatin, pale mucin vacuoles sitting INSIDE the wall rather than fused with the lumen, pink fibrillar collagen. The goblet vacuoles surviving into pass 2 are a v2 feature that v1's radial mucin wedges did not deliver.
The same comparison for normal, where the granule lattice hurts most
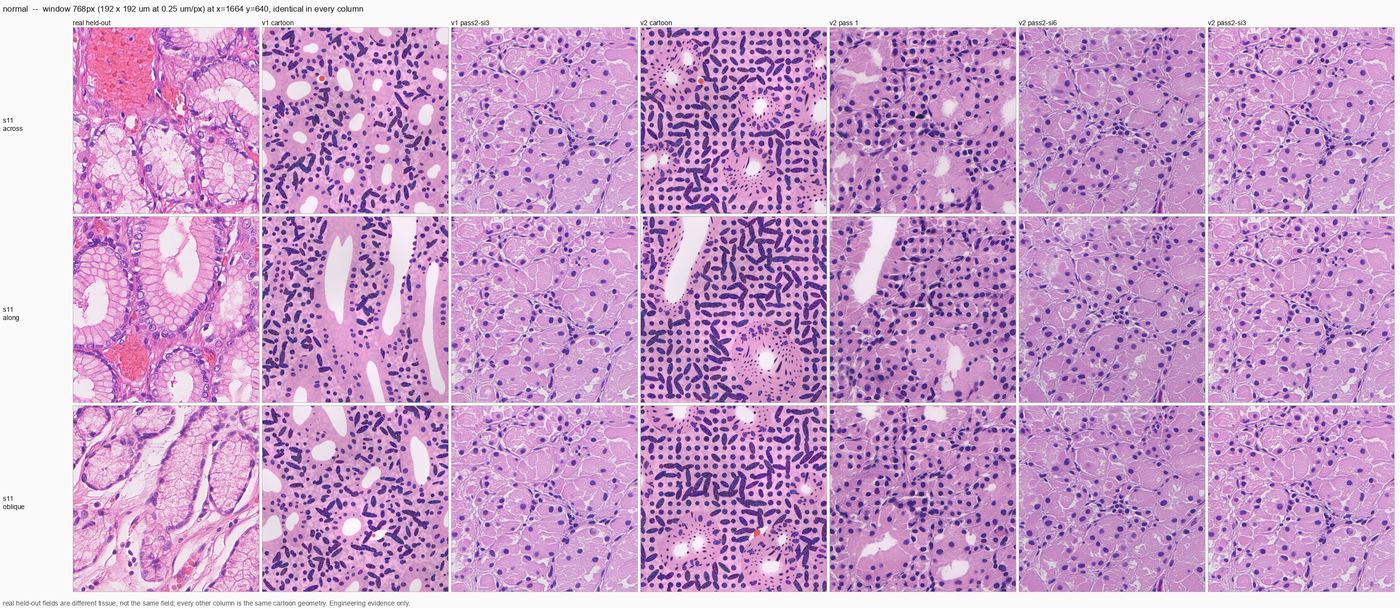
Same seven columns and three cut rows as the IM sheet. The v2 normal second-pass crops (columns 6 and 7) are sheets of pale polygonal cells with regularly spaced round nuclei and thin pink septa - plausible oxyntic cytology in a field with no glands in it. The real held-out column has obvious gland profiles with open lumina, and neither v1 nor v2 produces those. This is the visual counterpart of a ring median of exactly 0.000 at si6 for normal. Normal did improve on four of eight measures with the v2 cartoons (envelope, detail, ring density, ring-in-range) and still puts nothing inside the realism band.
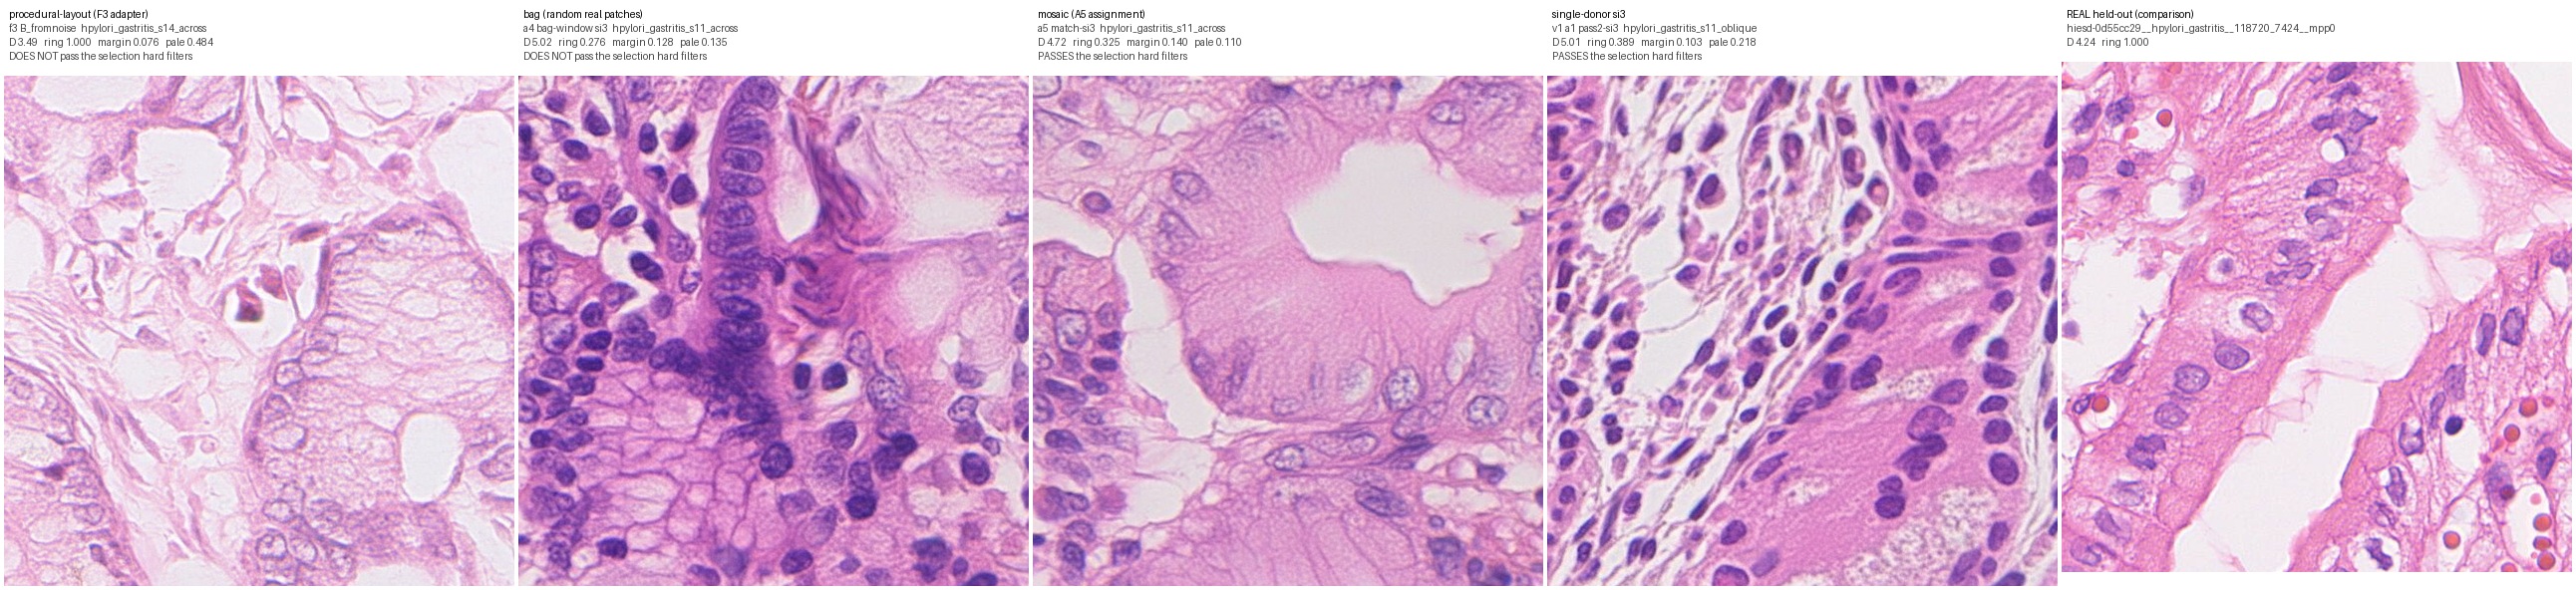
Selection comparison: hpylori gastritis
Lowest-D candidate in each method family beside real tissue. Intended labels; not clinical diagnoses.
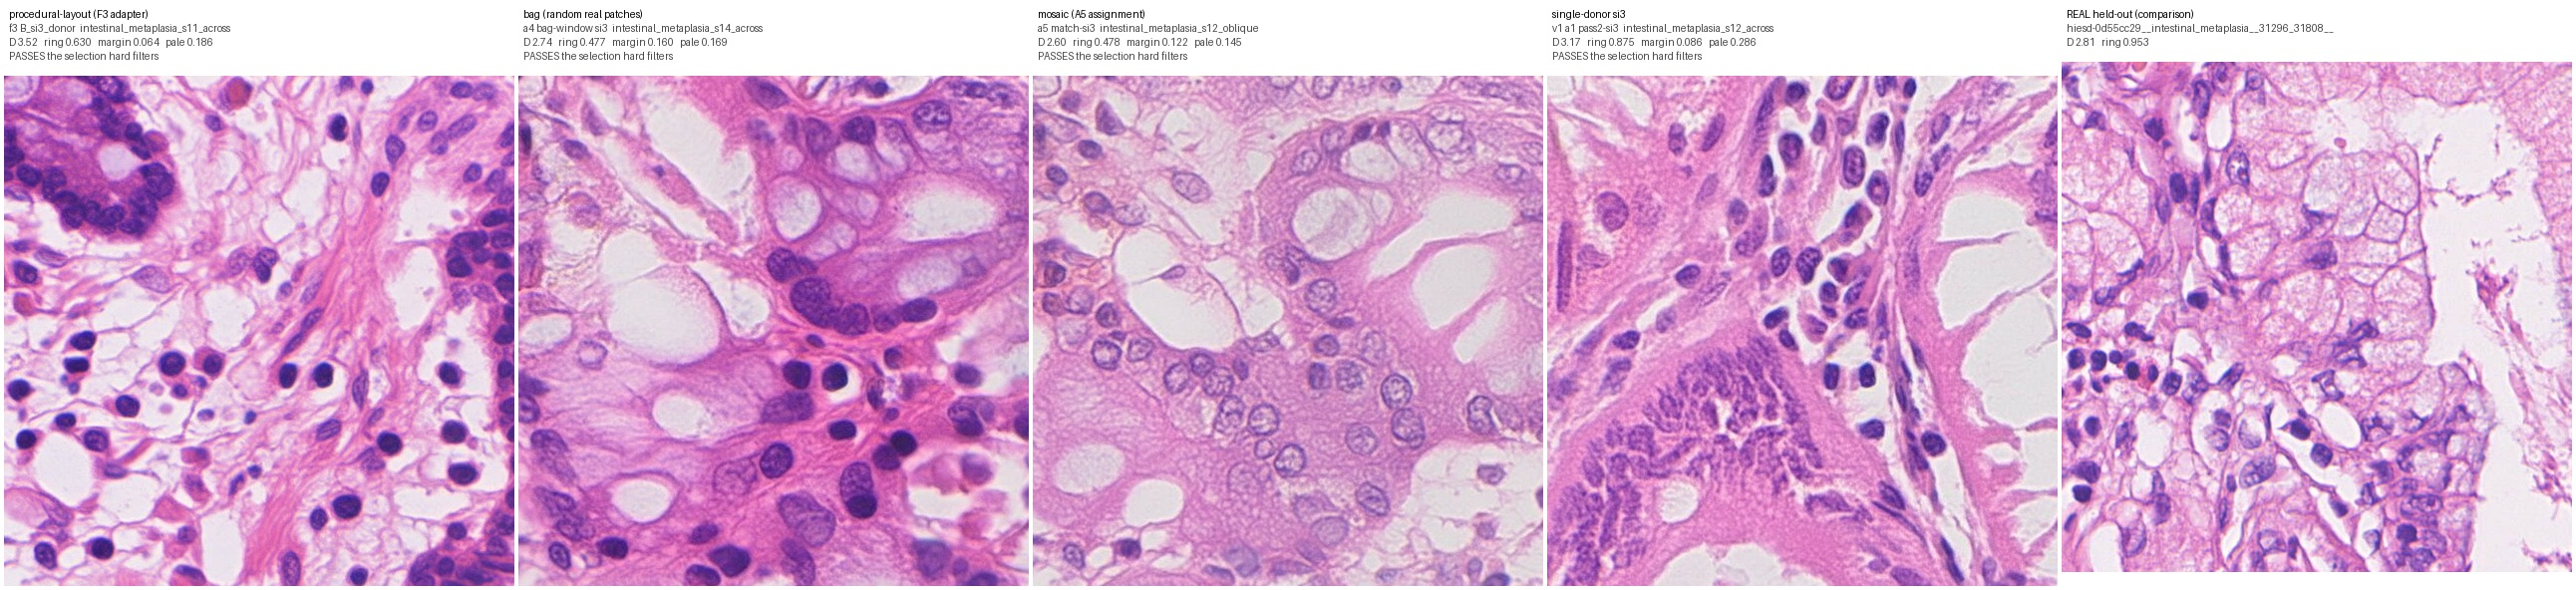
Selection comparison: intestinal metaplasia
Lowest-D candidate in each method family beside real tissue. Intended labels; not clinical diagnoses.
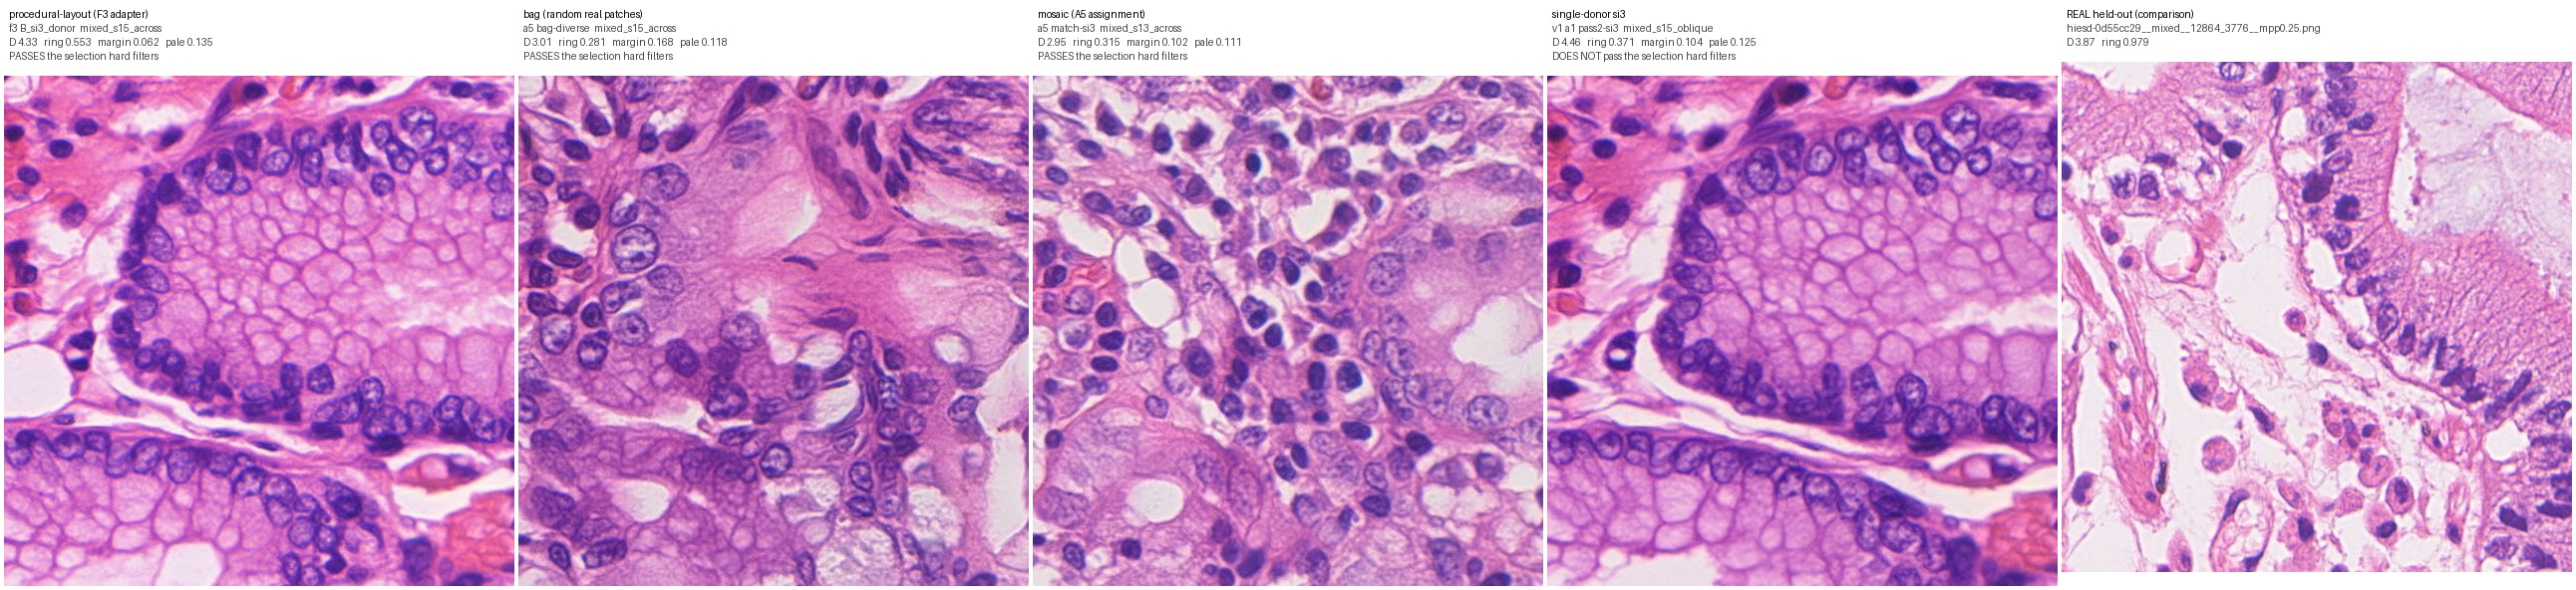
Selection comparison: mixed
Lowest-D candidate in each method family beside real tissue. Intended labels; not clinical diagnoses.
Selection comparison: normal
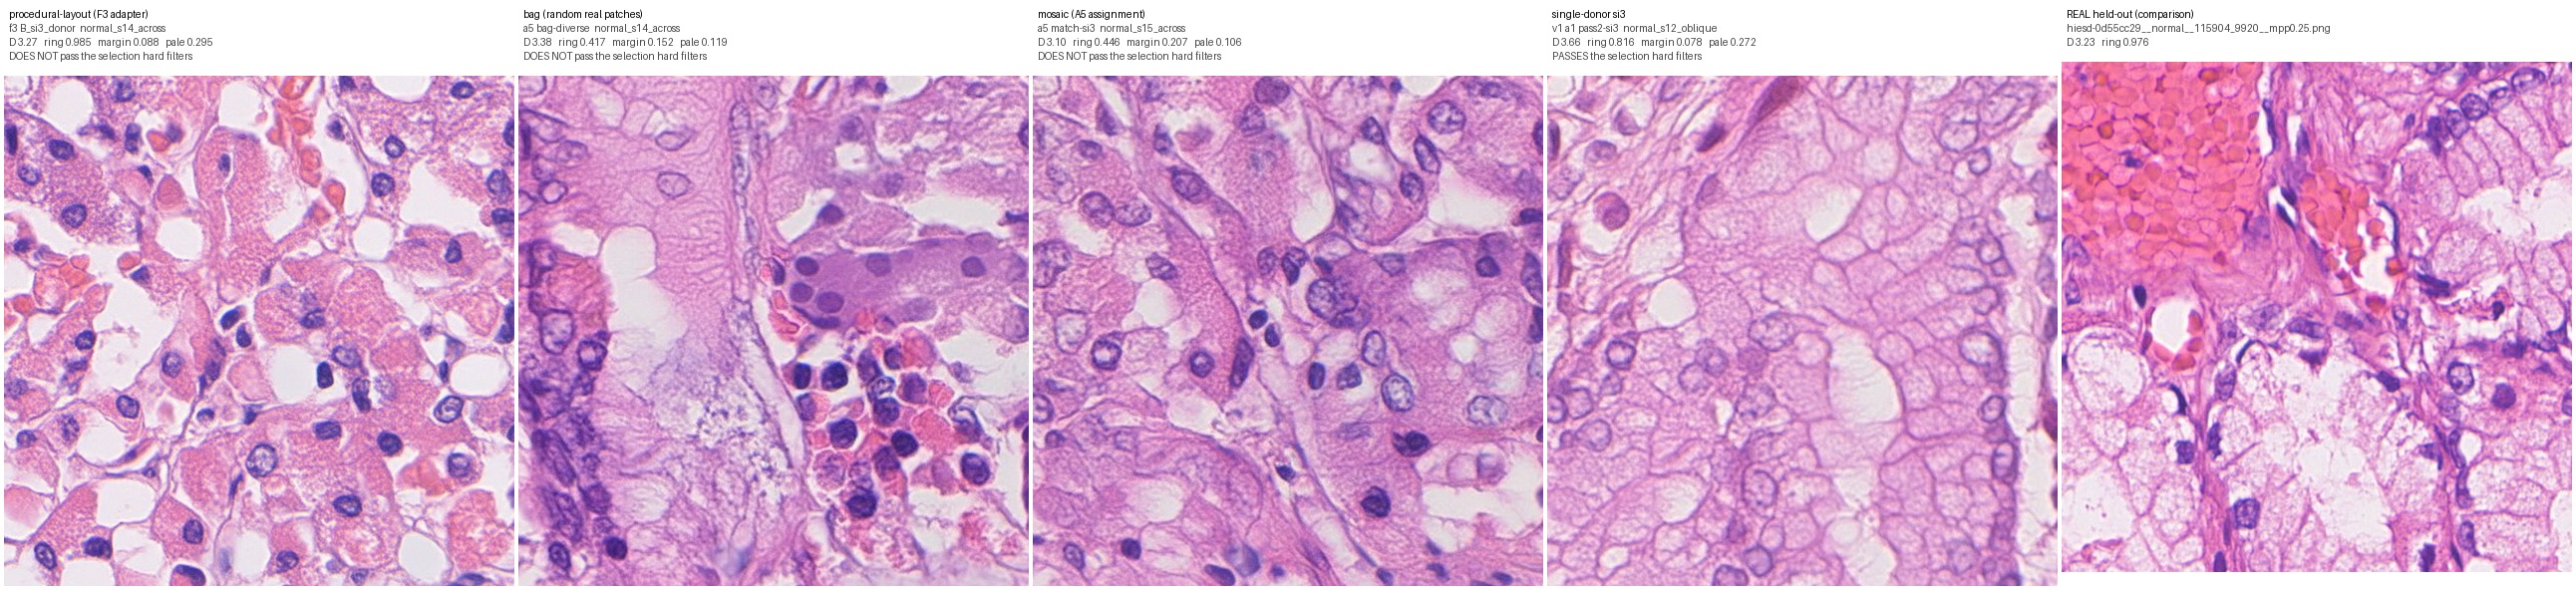
Lowest-D candidate in each method family beside real tissue. Intended labels; not clinical diagnoses.
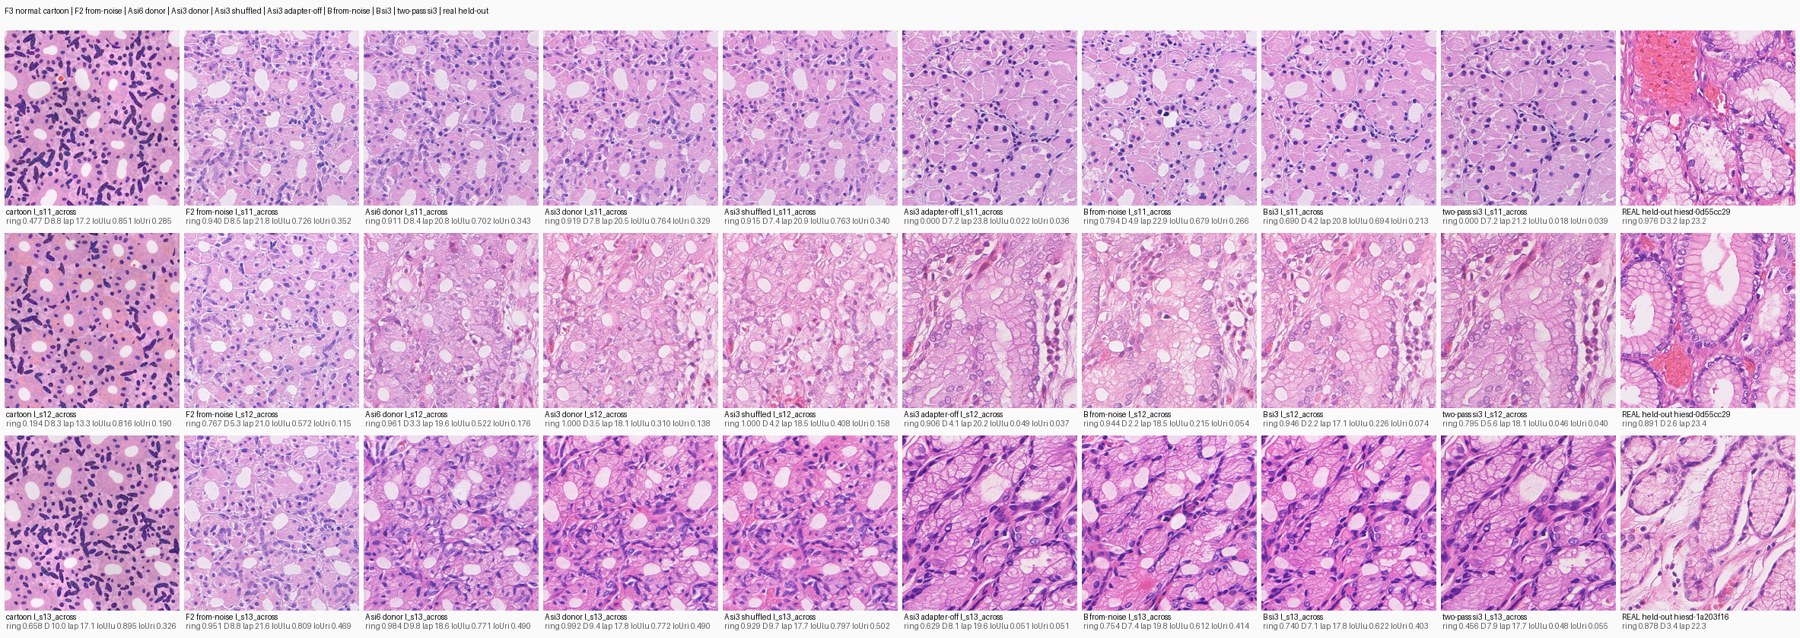
F3: f3-hpylori_gastritis
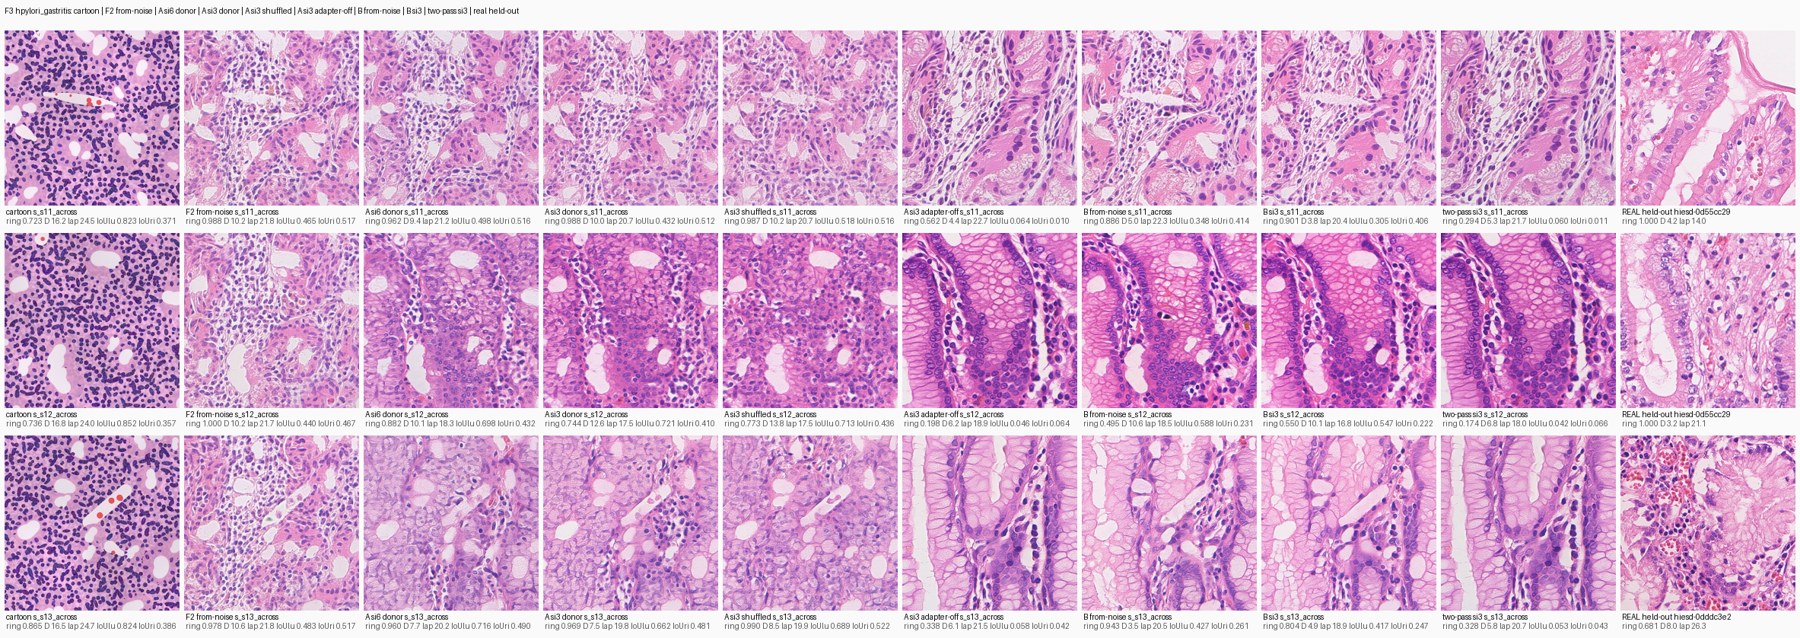
Dated F3 experiment sheet. Read alongside the corresponding report; preview resized for web.
F3: f3-intestinal_metaplasia
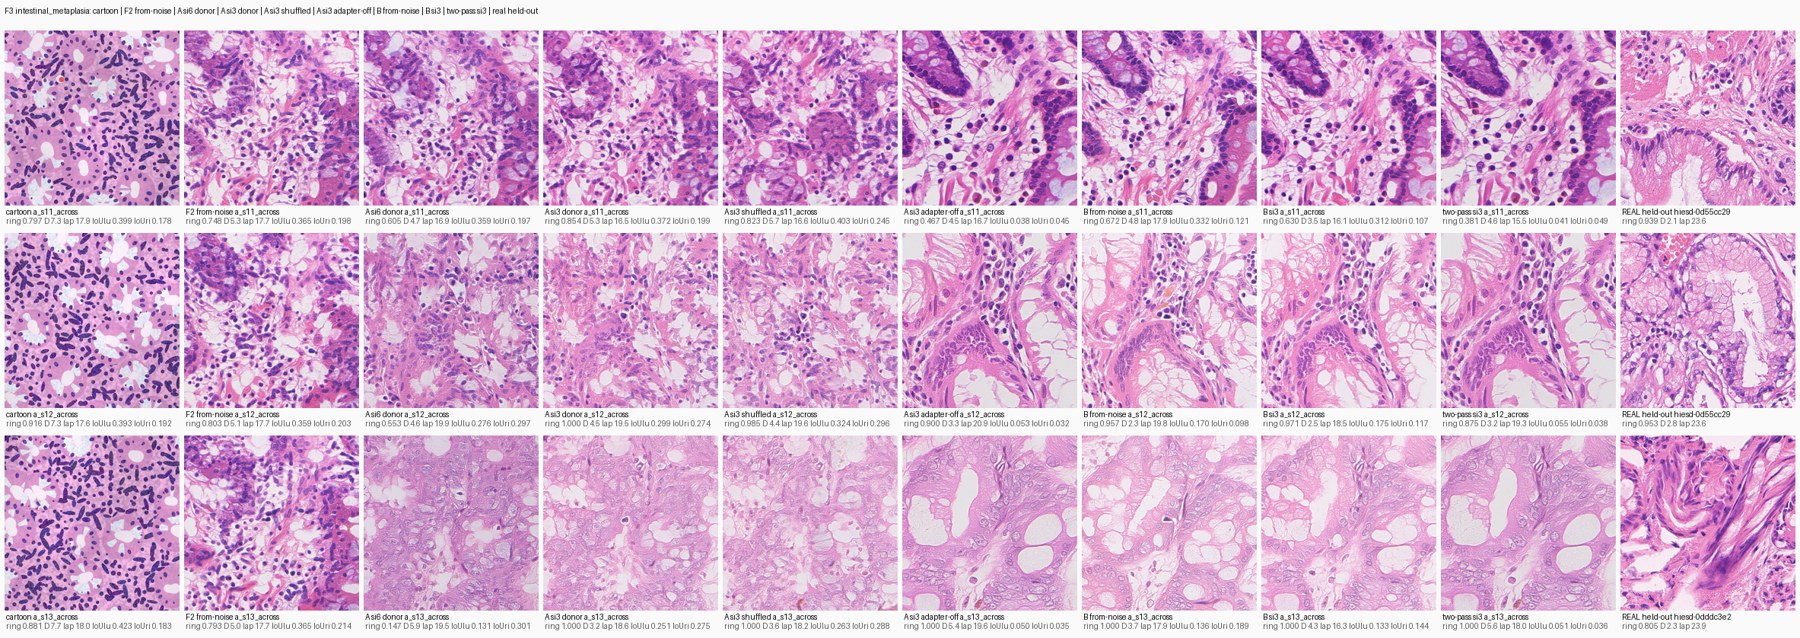
Dated F3 experiment sheet. Read alongside the corresponding report; preview resized for web.
F3: f3-mixed
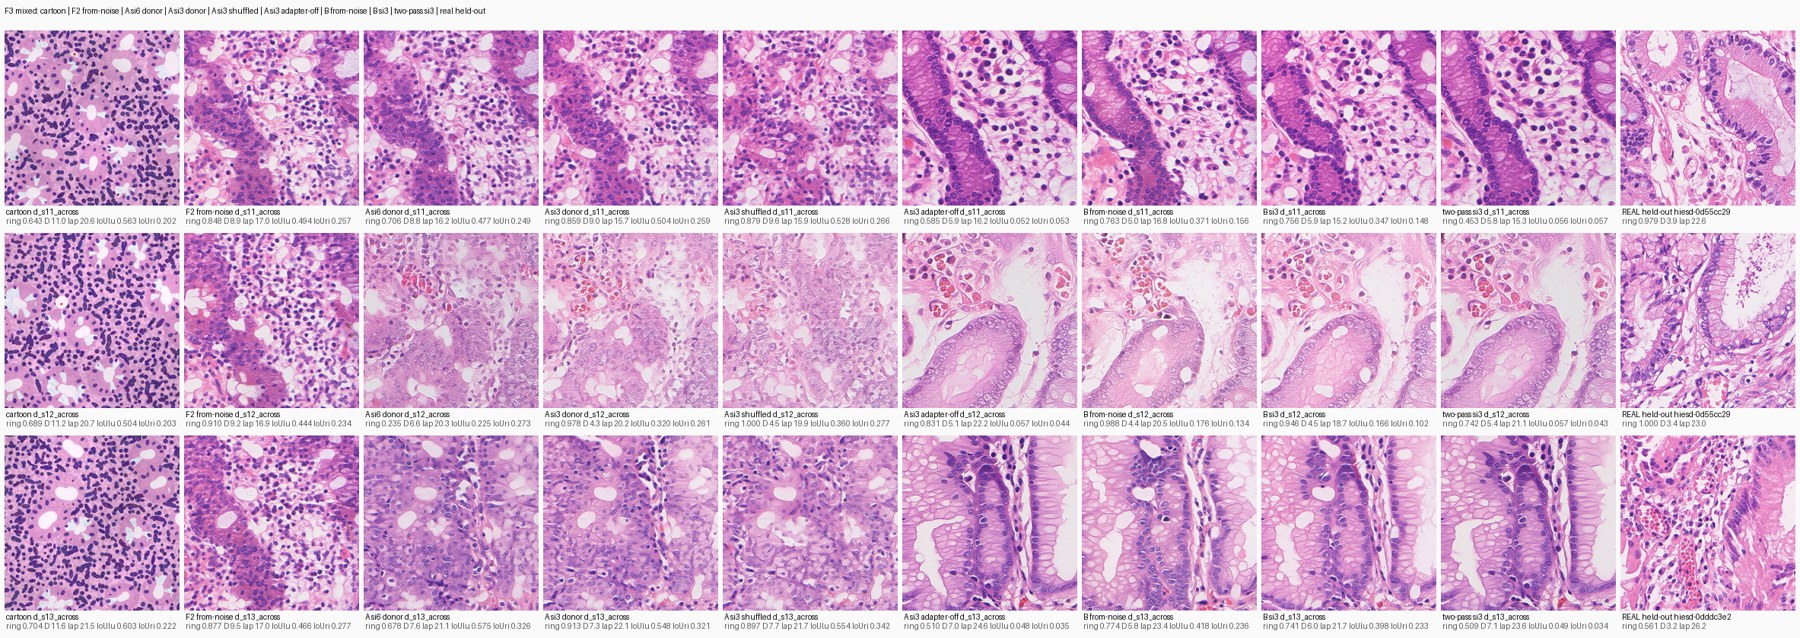
Dated F3 experiment sheet. Read alongside the corresponding report; preview resized for web.
F3: f3-normal
Dated F3 experiment sheet. Read alongside the corresponding report; preview resized for web.
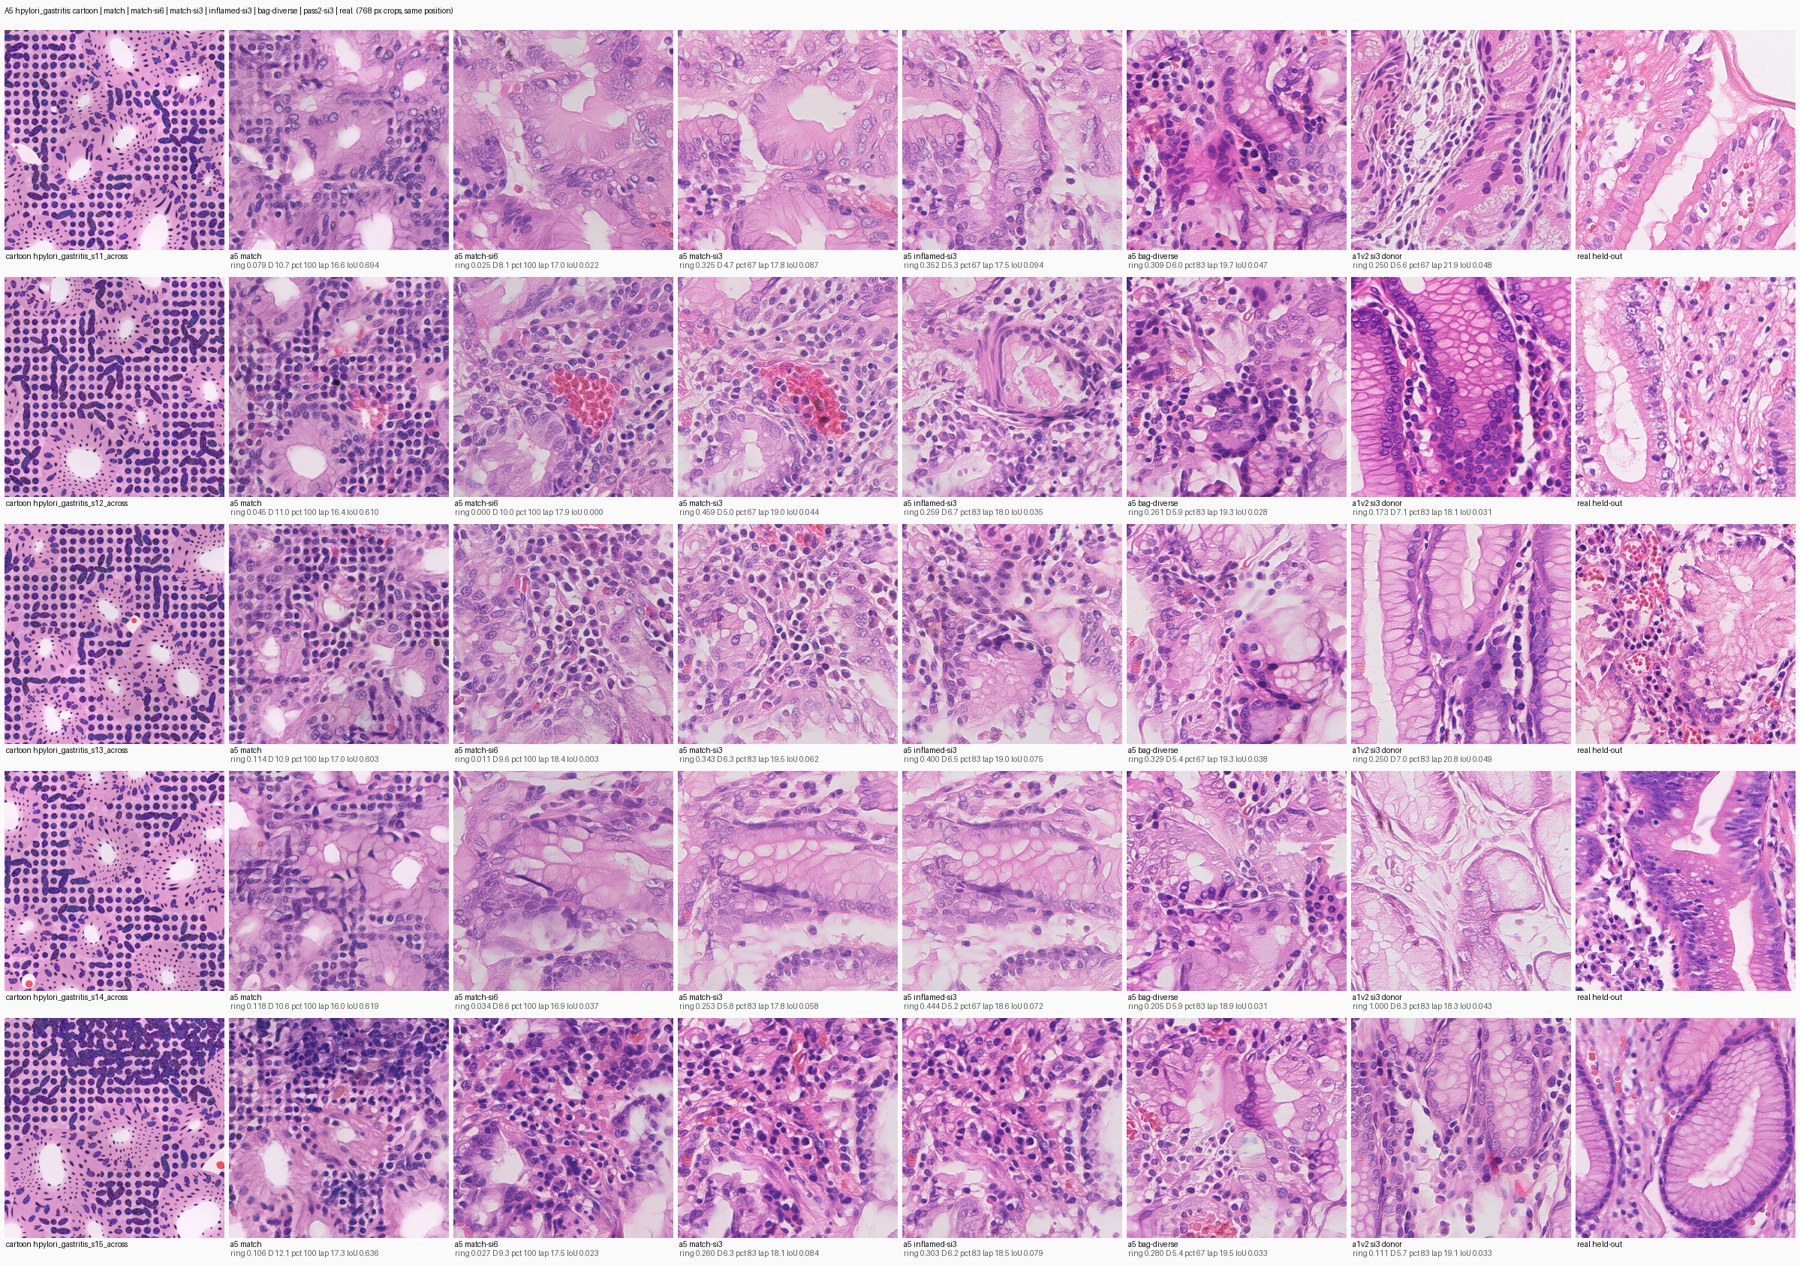
A5: a5-hpylori_gastritis
Dated A5 experiment sheet. Read alongside the corresponding report; preview resized for web.
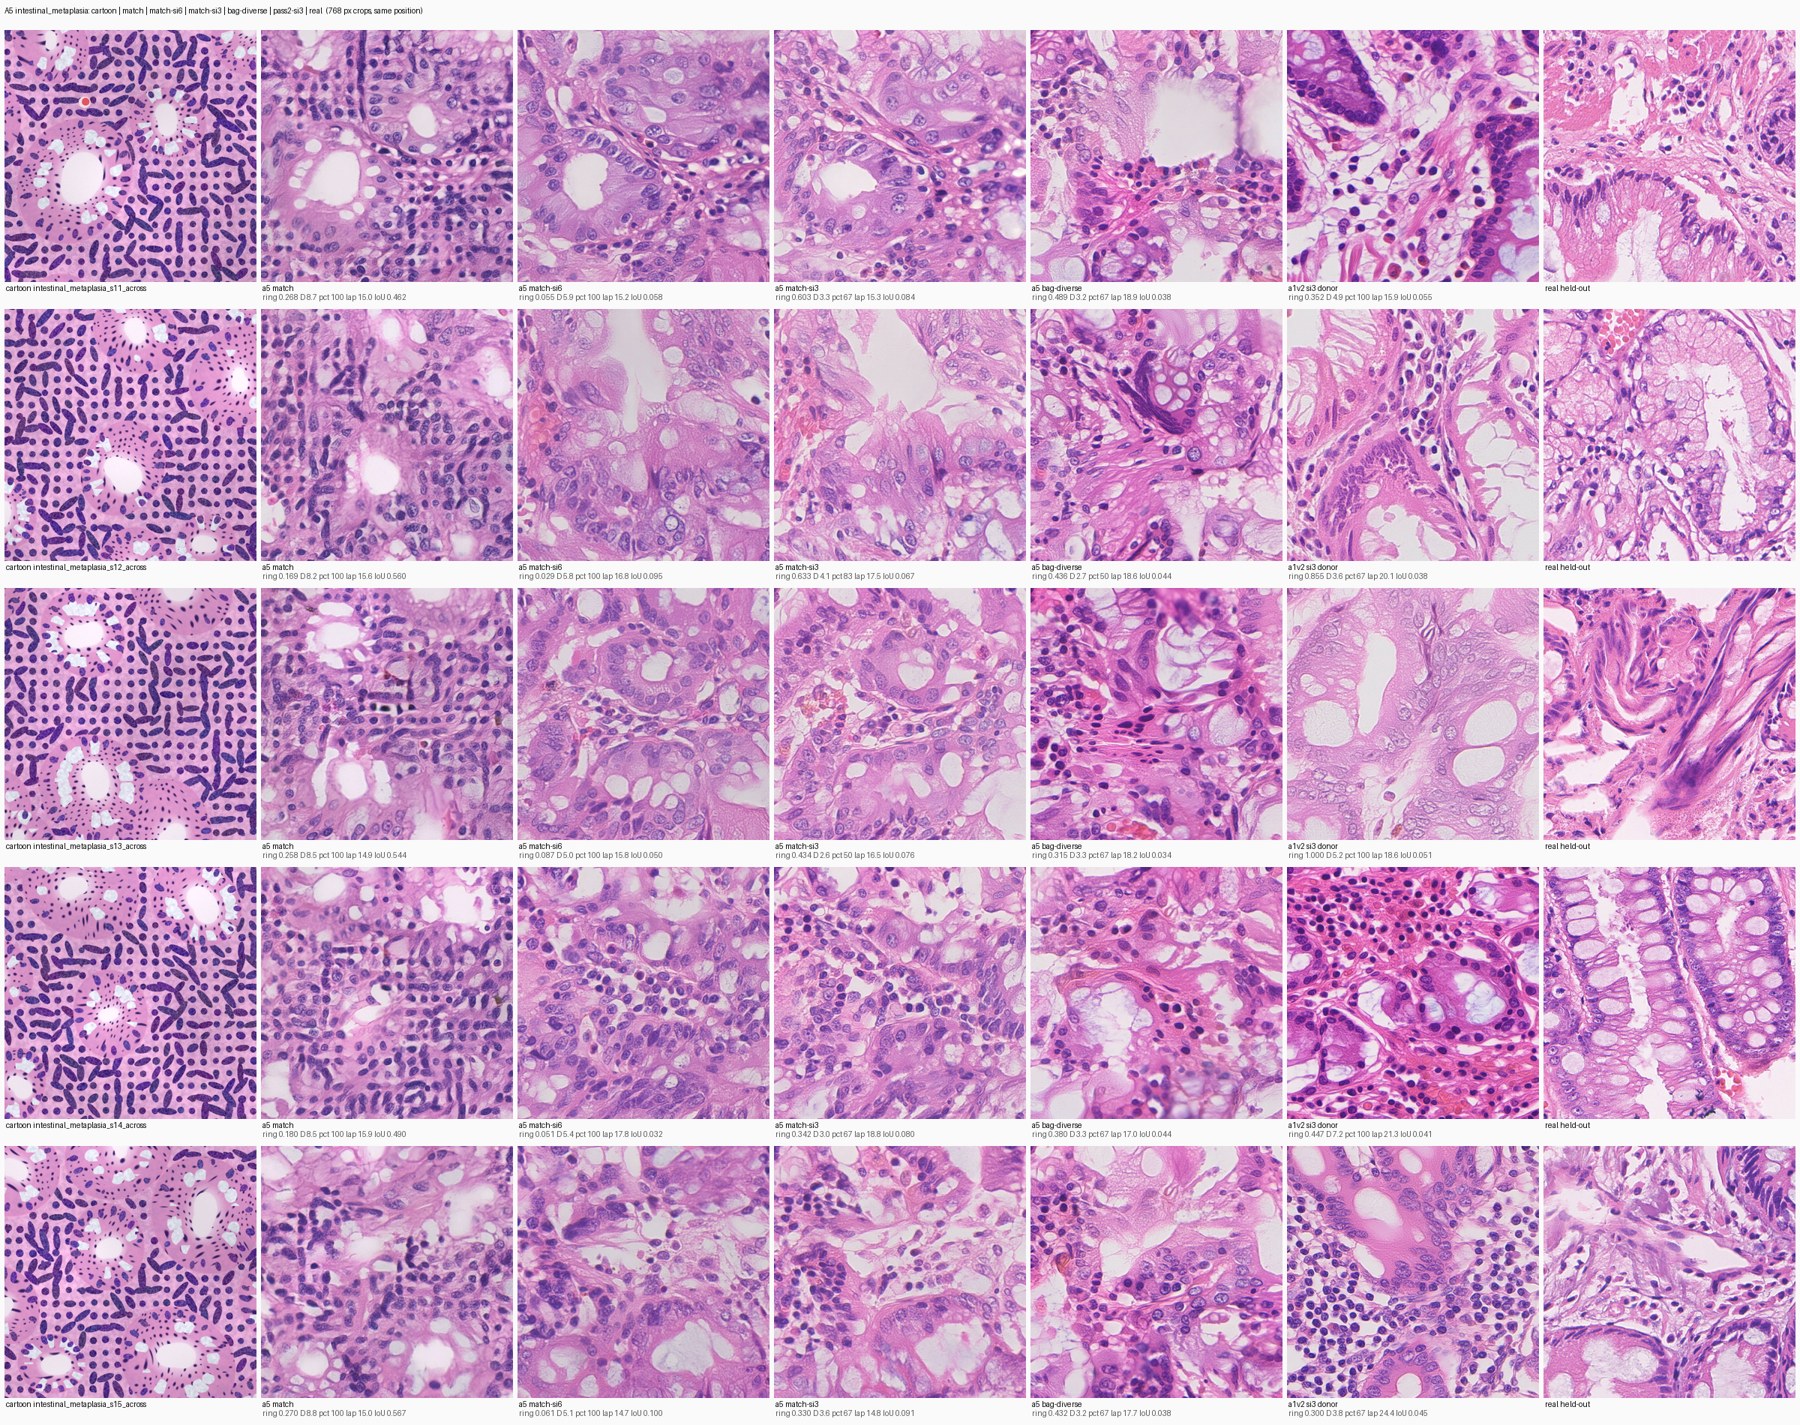
A5: a5-intestinal_metaplasia
Dated A5 experiment sheet. Read alongside the corresponding report; preview resized for web.
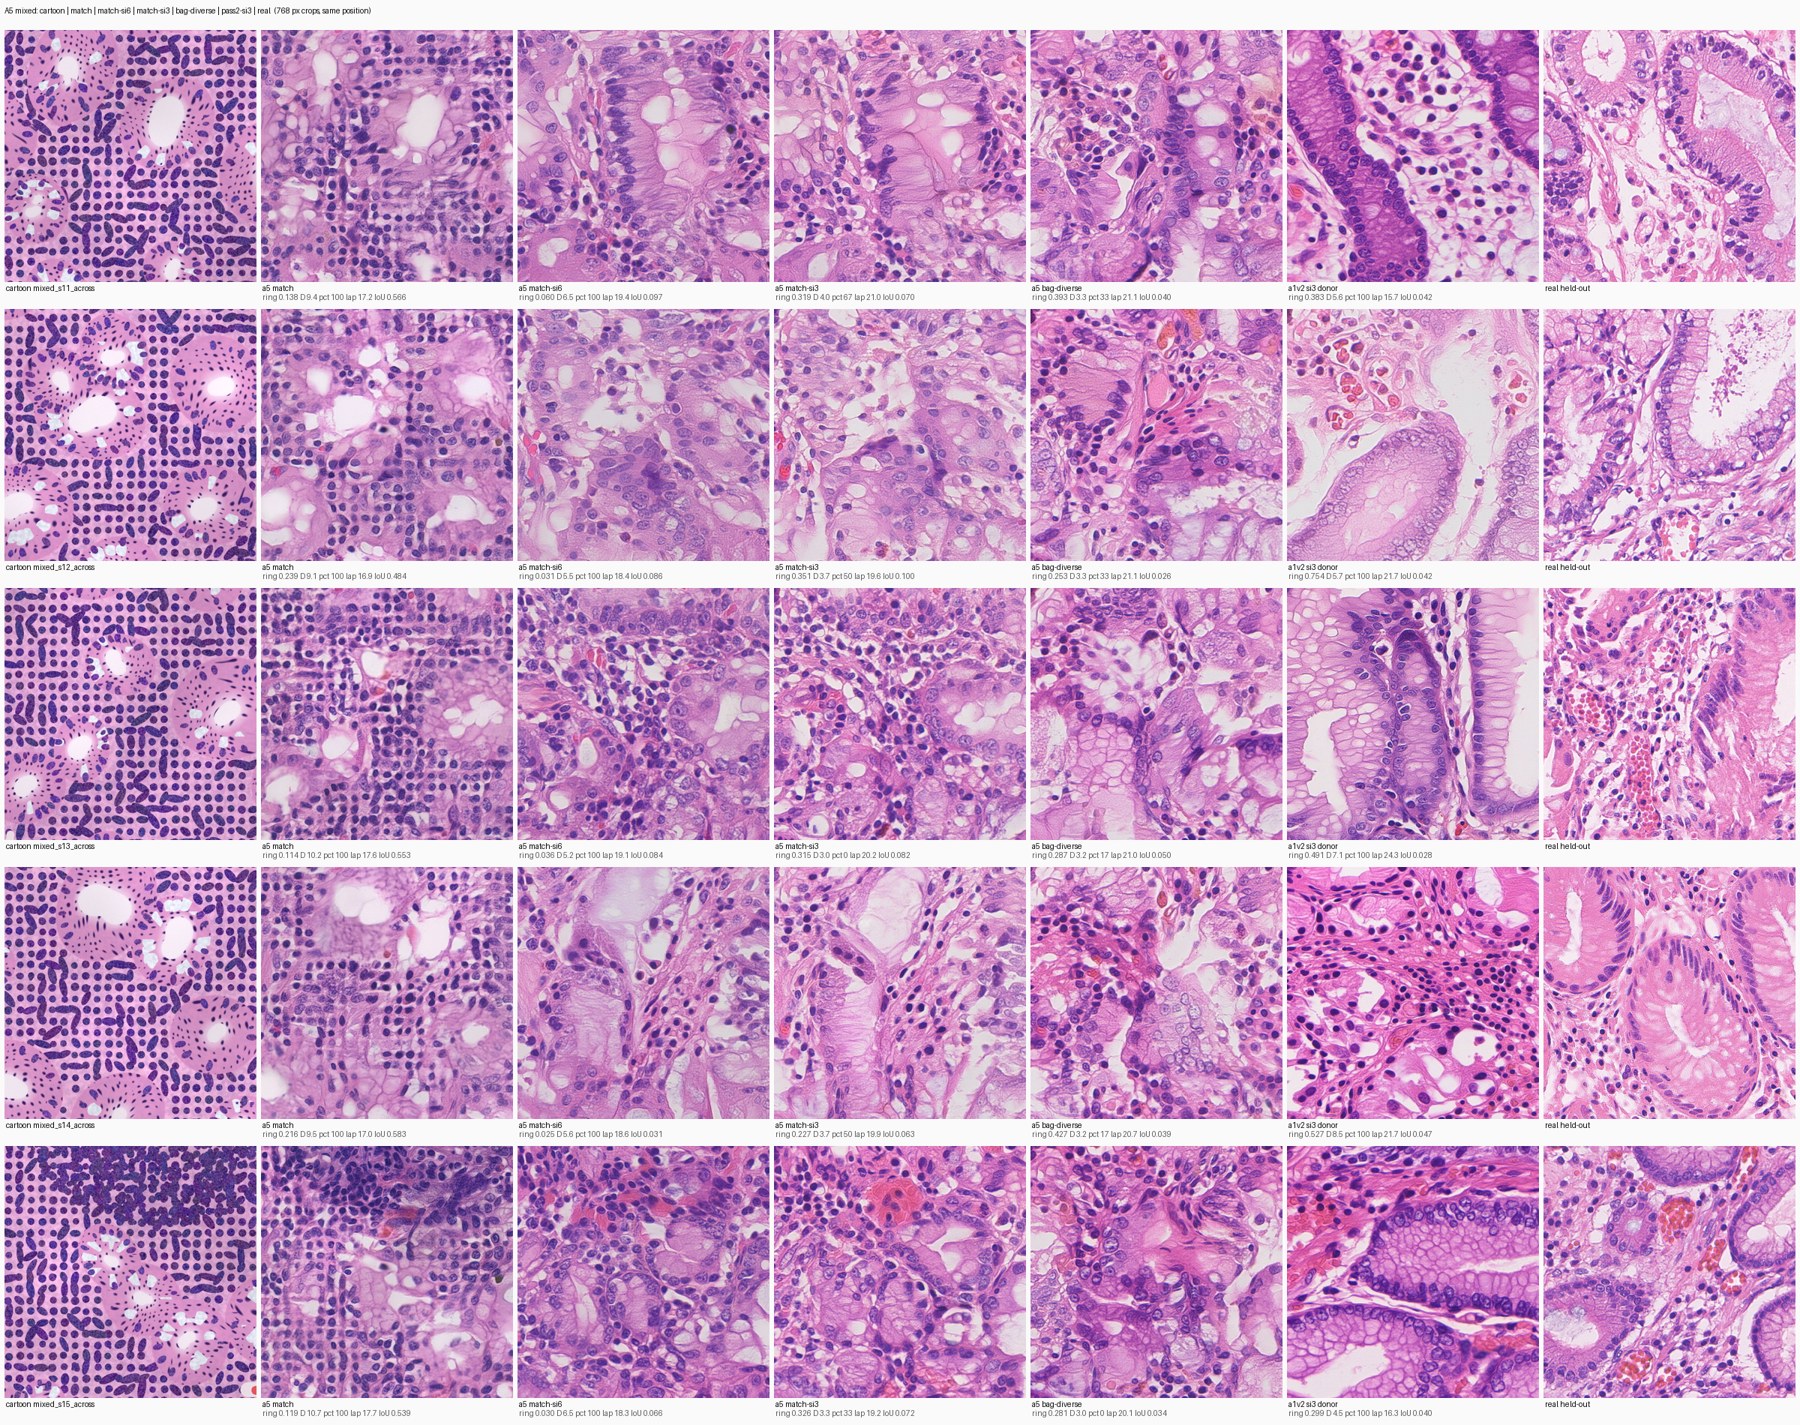
A5: a5-mixed
Dated A5 experiment sheet. Read alongside the corresponding report; preview resized for web.
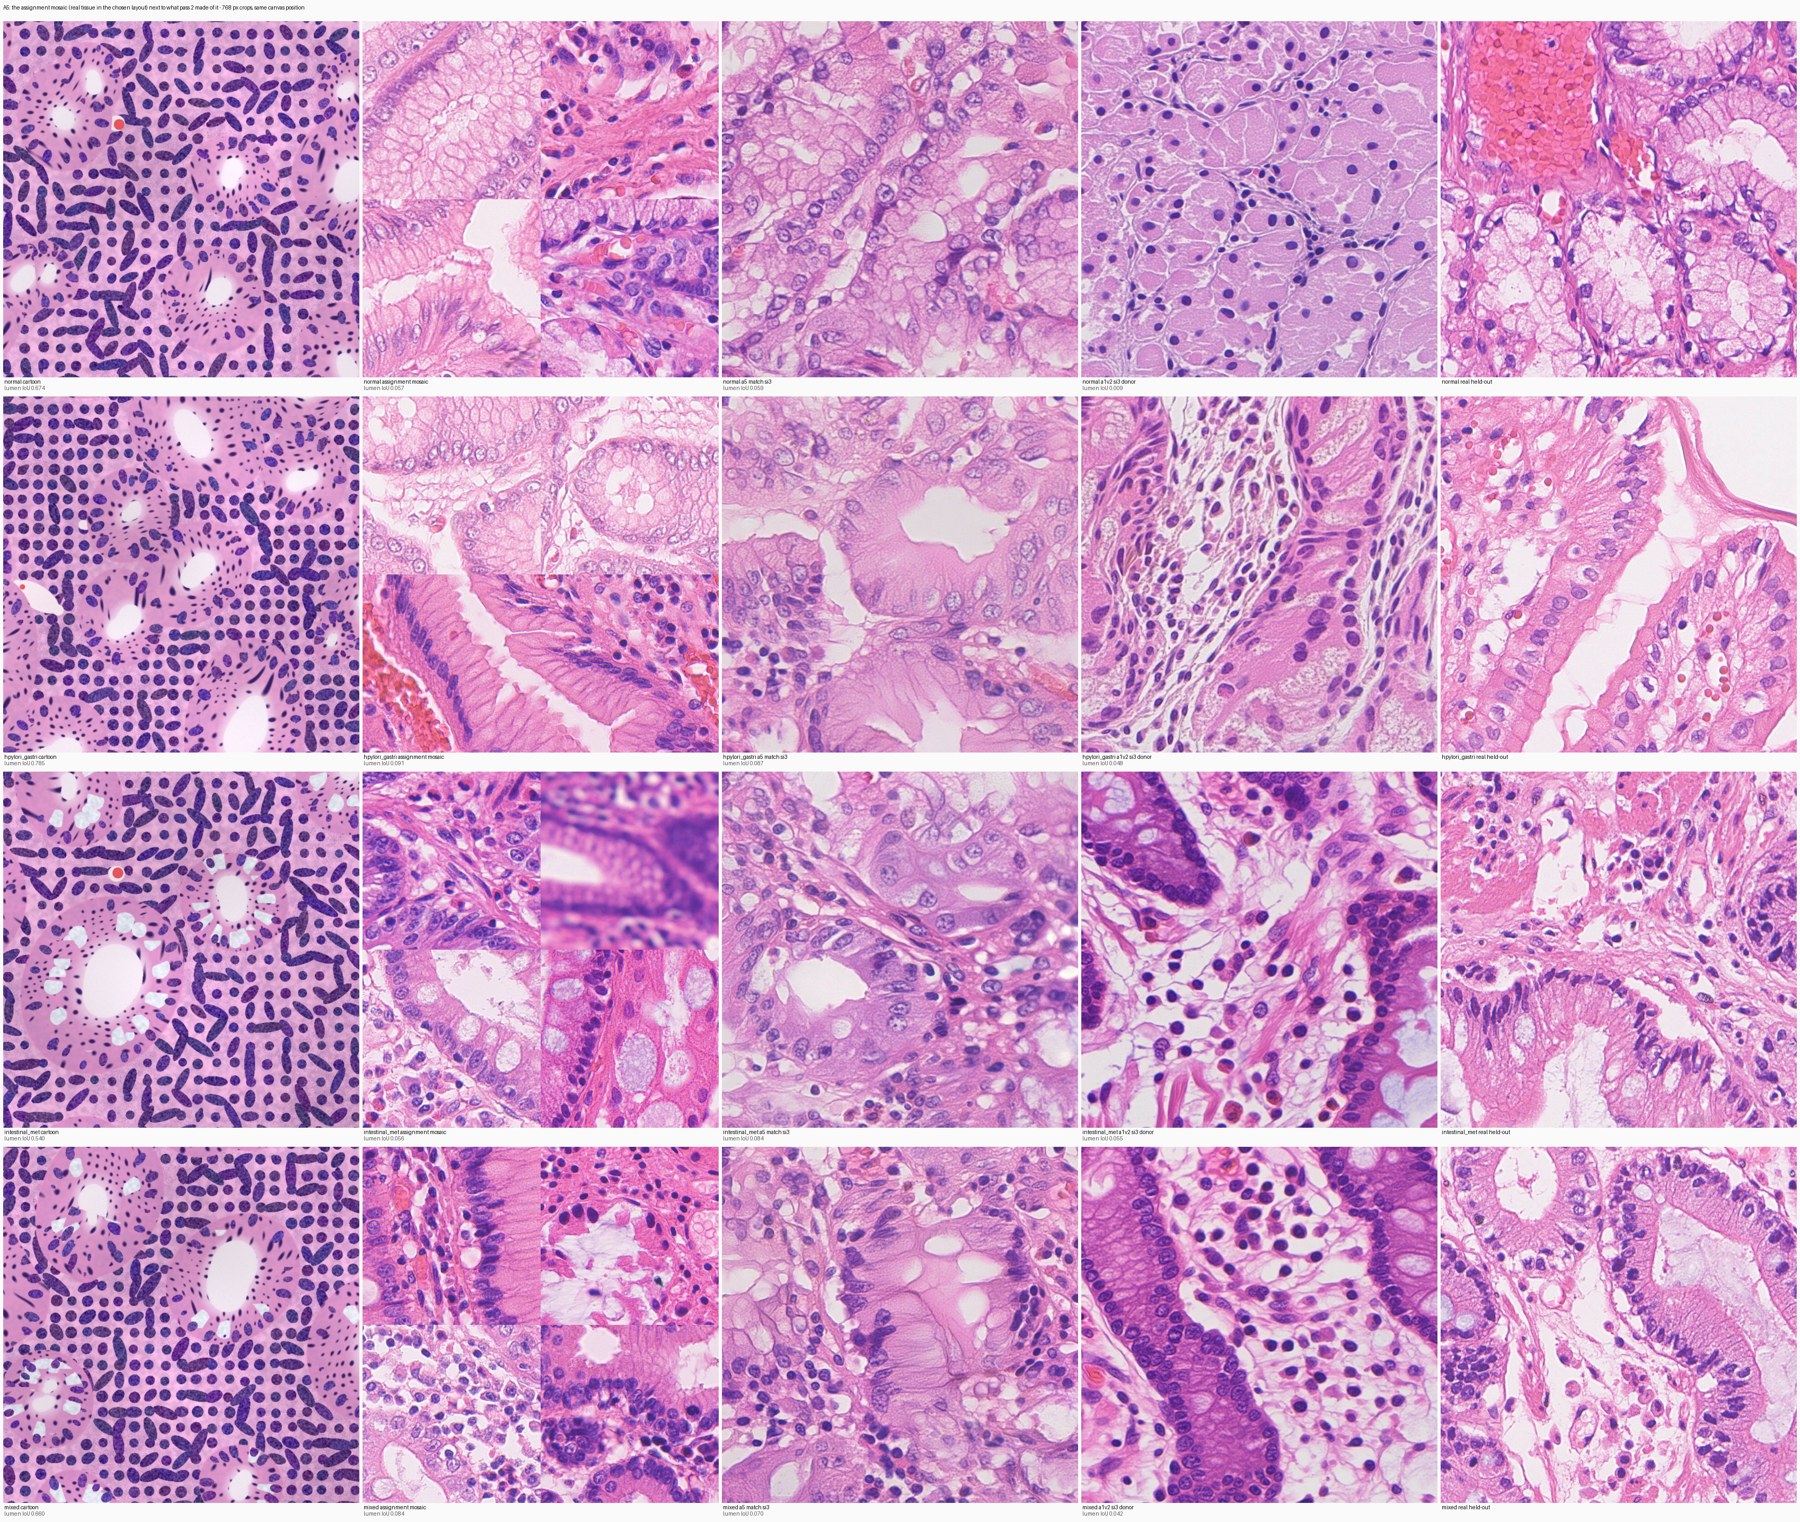
A5: a5-mosaic-vs-output
Dated A5 experiment sheet. Read alongside the corresponding report; preview resized for web.
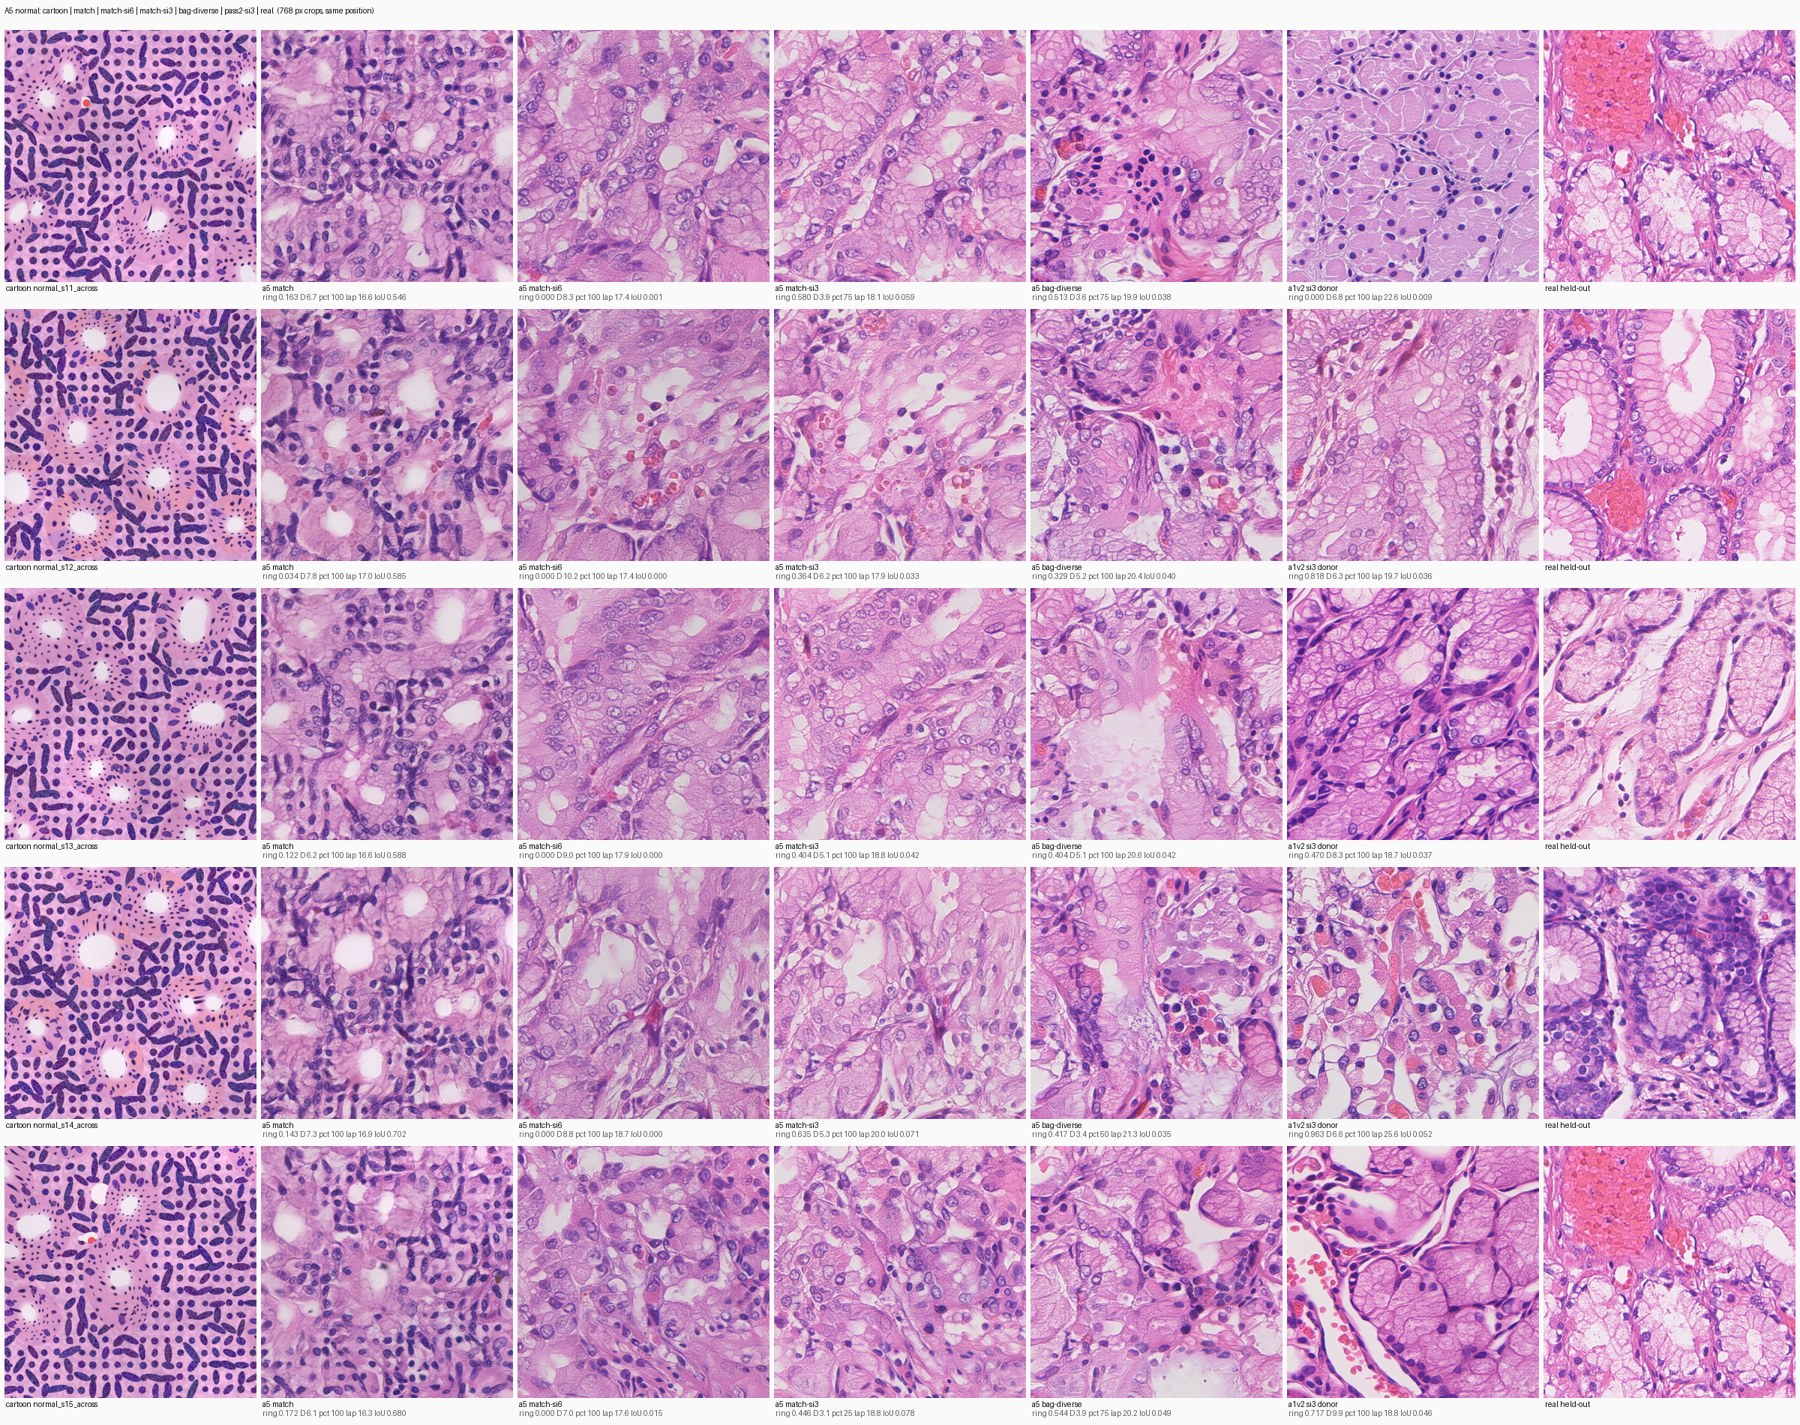
A5: a5-normal
Dated A5 experiment sheet. Read alongside the corresponding report; preview resized for web.
A5: a5-zoom-hpylori_gastritis
Dated A5 experiment sheet. Read alongside the corresponding report; preview resized for web.
A5: a5-zoom-intestinal_metaplasia
Dated A5 experiment sheet. Read alongside the corresponding report; preview resized for web.
A5: a5-zoom-mixed
Dated A5 experiment sheet. Read alongside the corresponding report; preview resized for web.
A5: a5-zoom-normal
Dated A5 experiment sheet. Read alongside the corresponding report; preview resized for web.