Synthetic gastric H&E fields for the SGH challenge
Grail Computer · preselection set · 9 September 2026 · ten 4096×2048 RGB PNG images at 0.25 µm/px (3 H. pylori gastritis, 2 intestinal metaplasia, 2 mixed, 3 normal)
What this document is. The ten images we propose to submit, the real fields they were measured against, the best images from every method we tried, and the method that produced the ten. Every number is an engineering measurement; no pathologist has reviewed any image, the H. pylori organisms are drawn procedurally, and the category names are the labels of the public dataset fields each image was generated for. Those three caveats are repeated where they matter.
1. The original reference
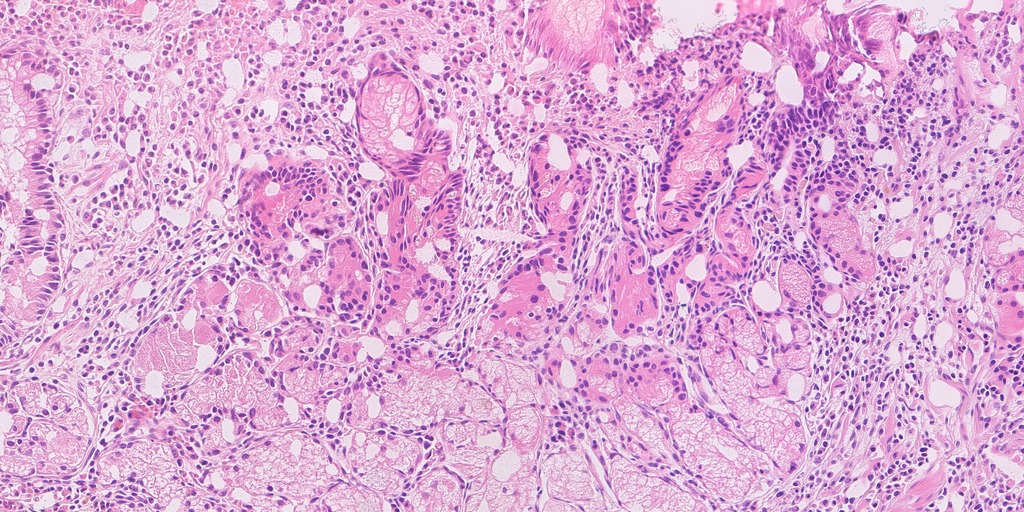
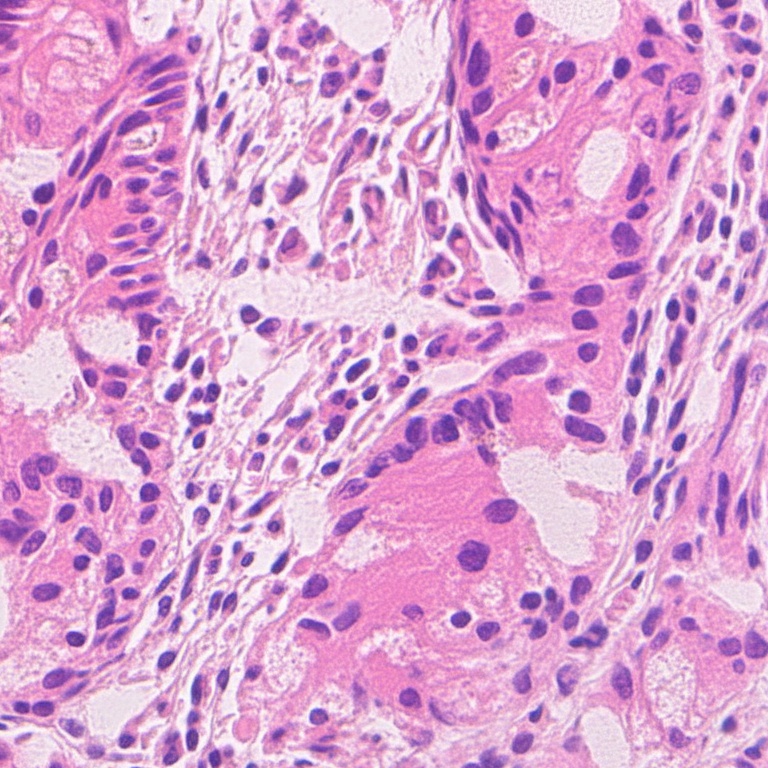
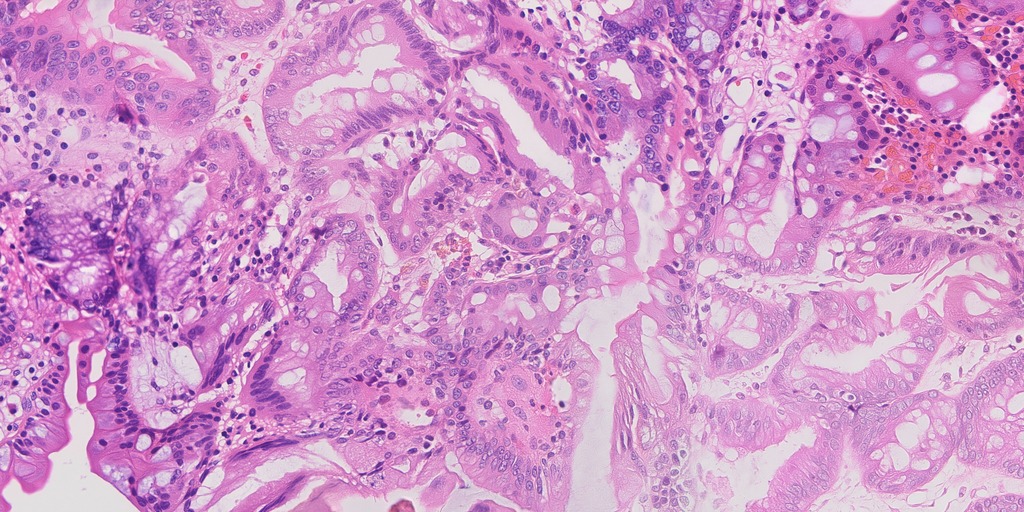
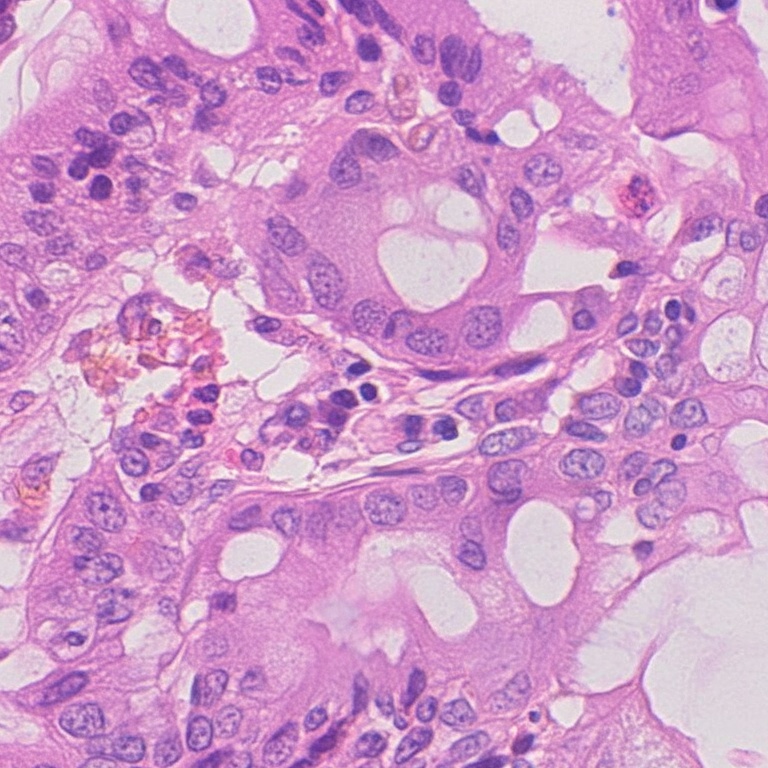
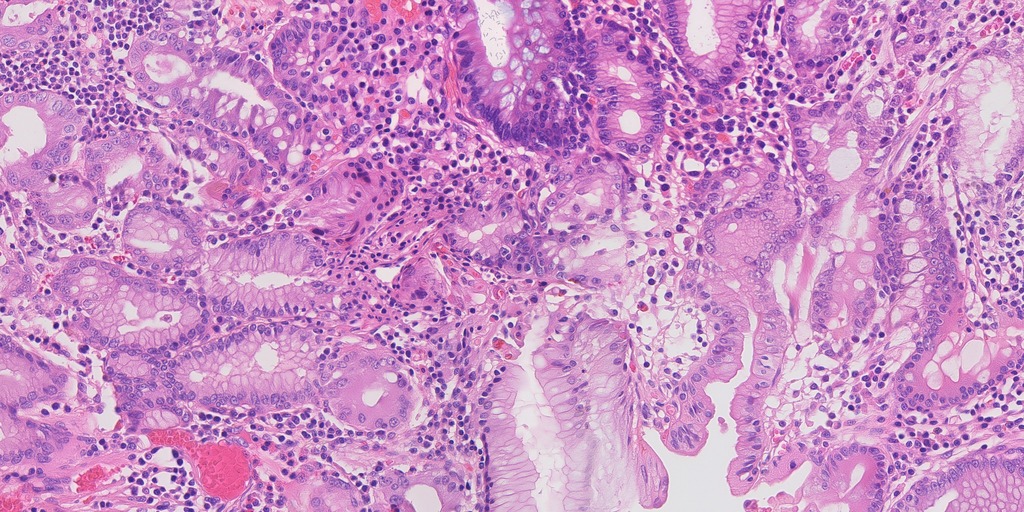
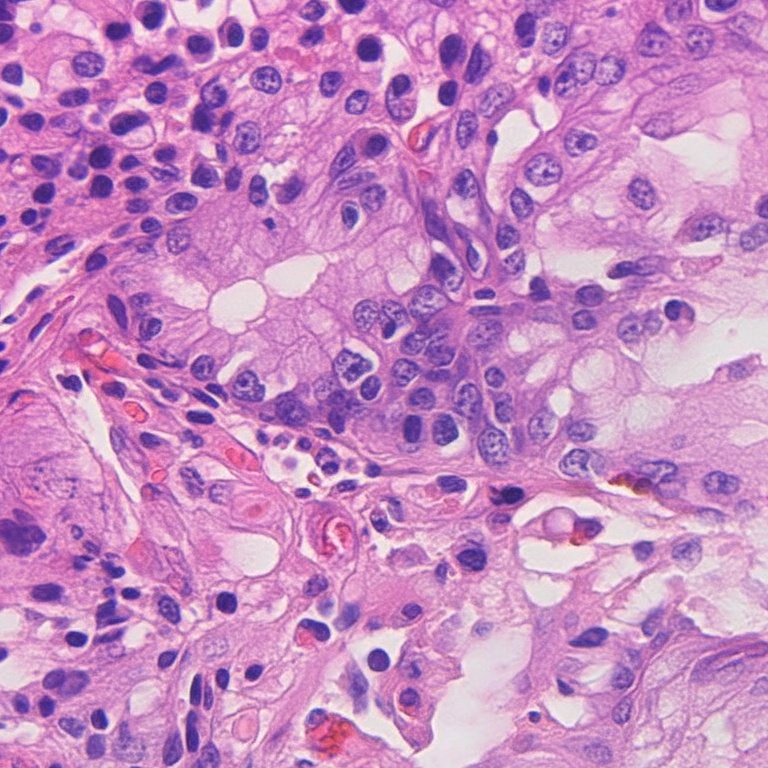
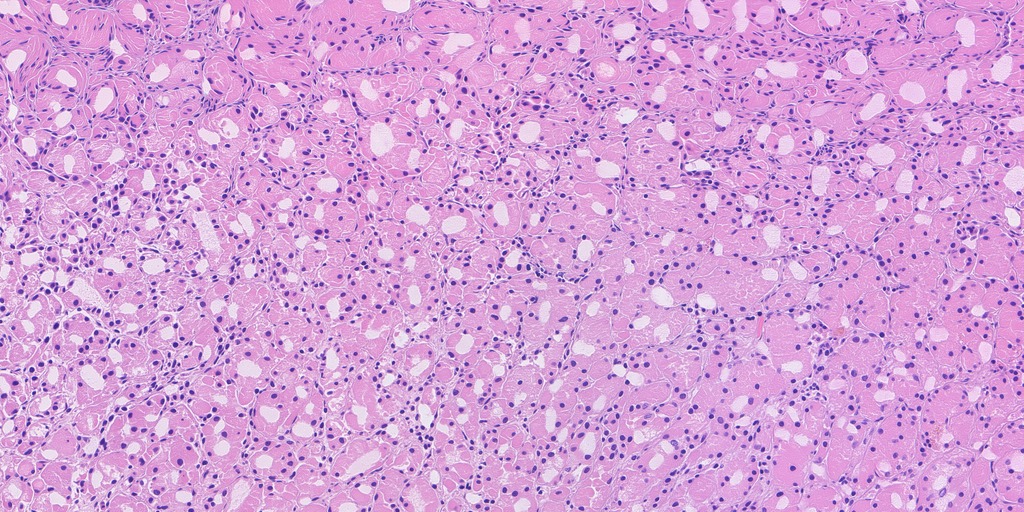
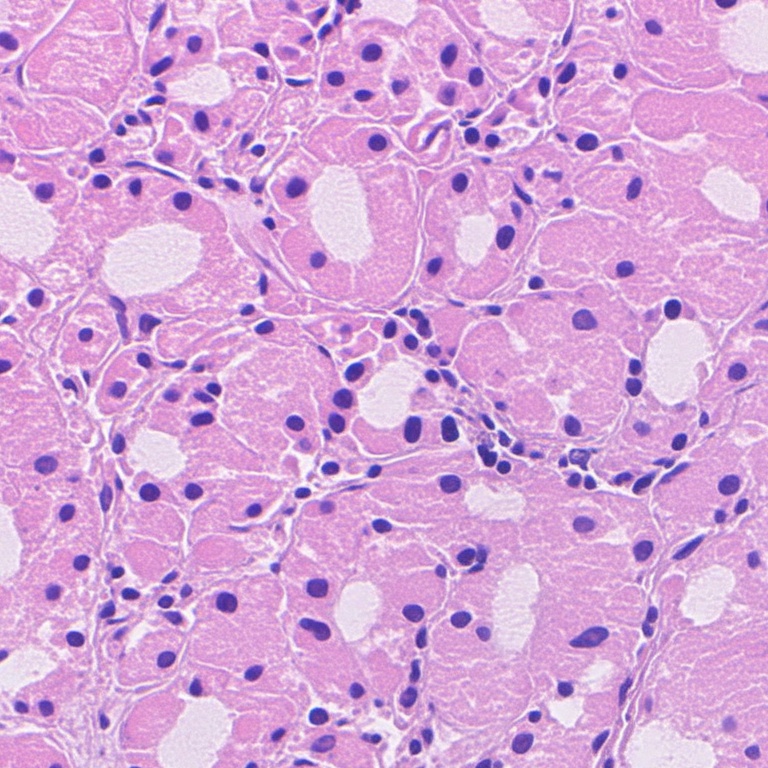
All real tissue in this work is from HiESD, a public dataset of 17 whole gastric slides (CC BY 4.0). Three slides were held out from every tuning and training step; the fields below are from held‑out slide 0d55cc29 and are the reference the ten were compared against. Left: the full 4096×2048 field (1024 × 512 µm). Right: a 768‑pixel window at native resolution (192 µm across), where one cell nucleus is about 30 pixels wide.
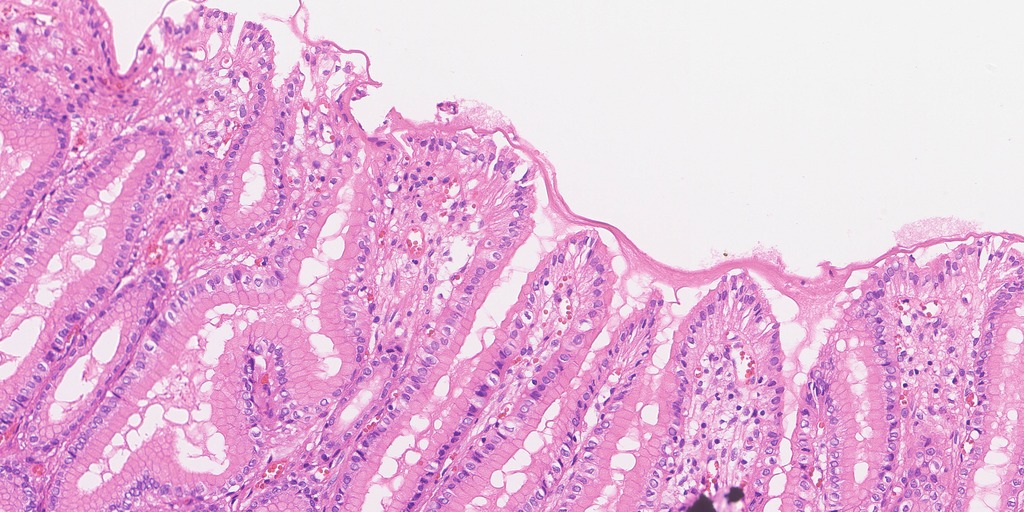
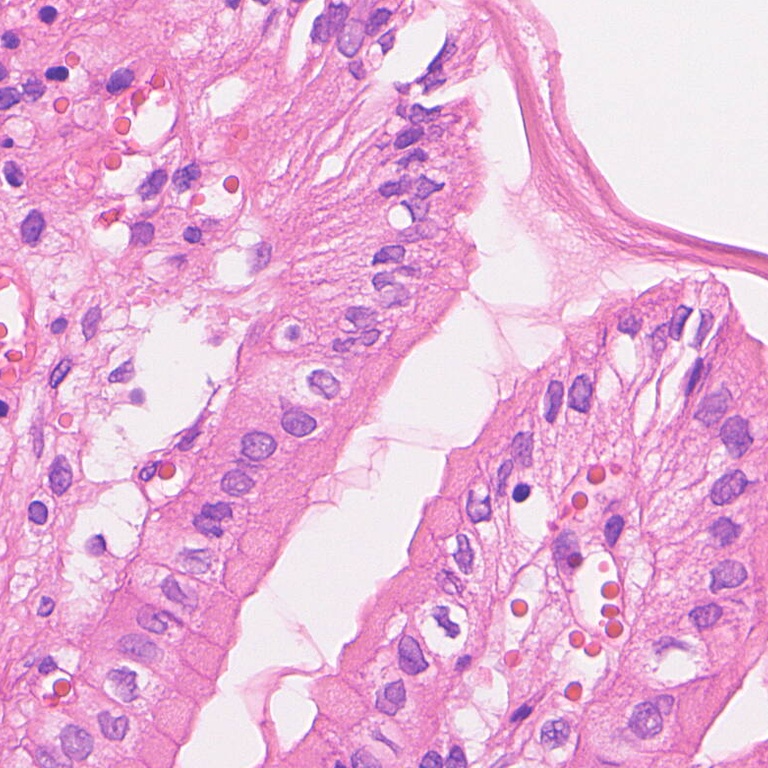
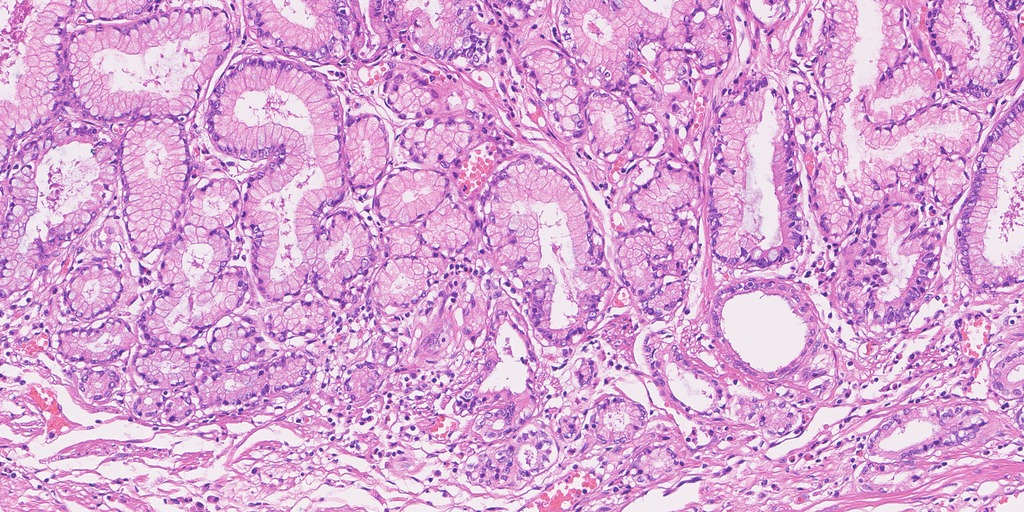
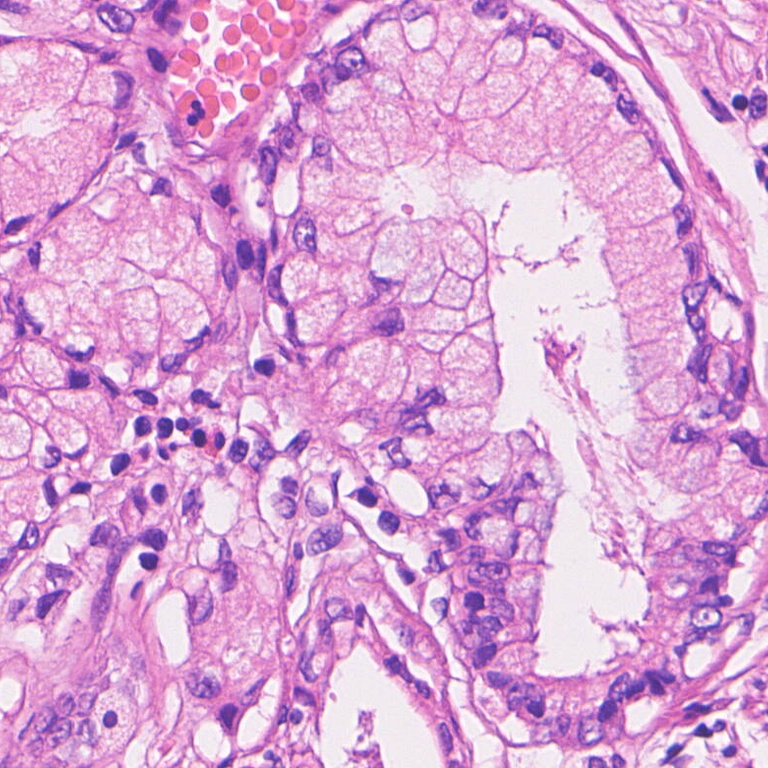
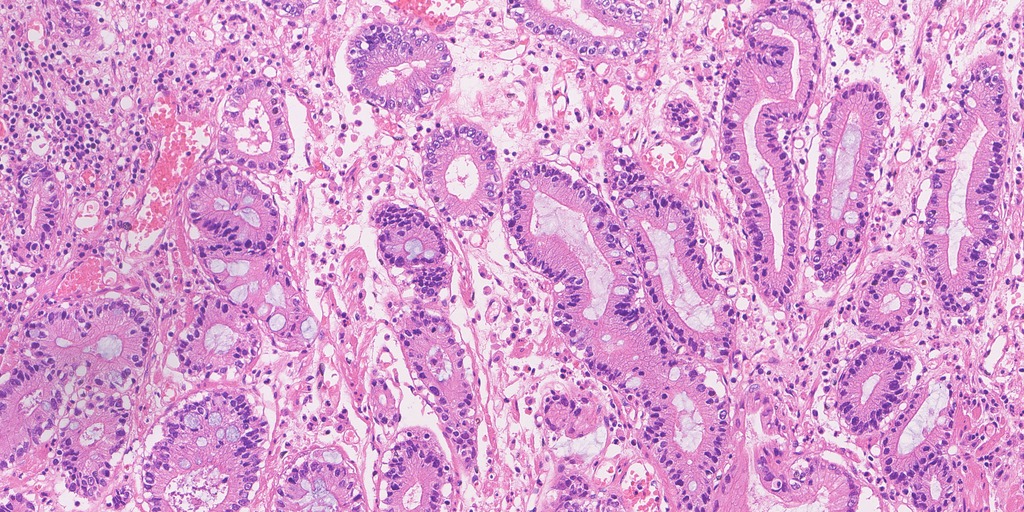
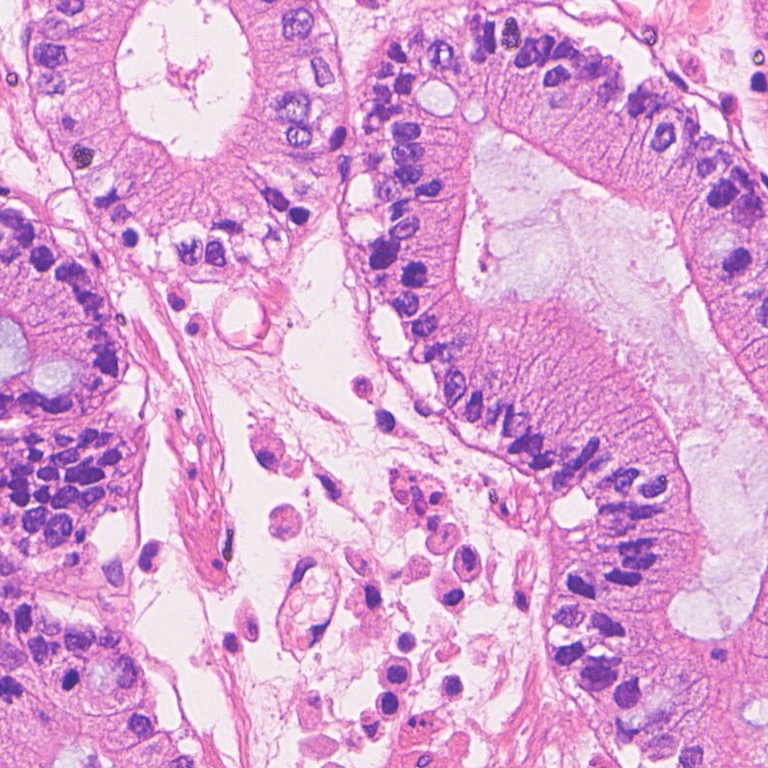
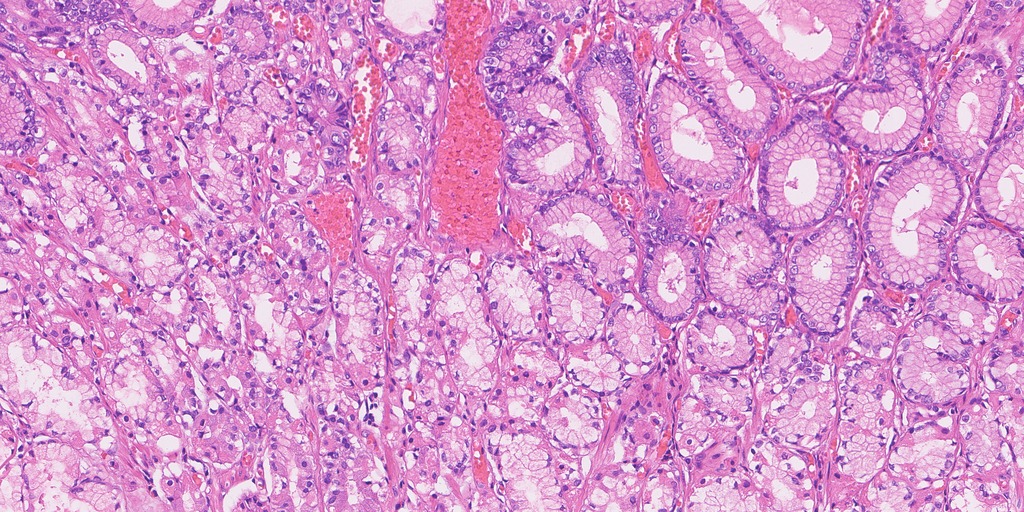
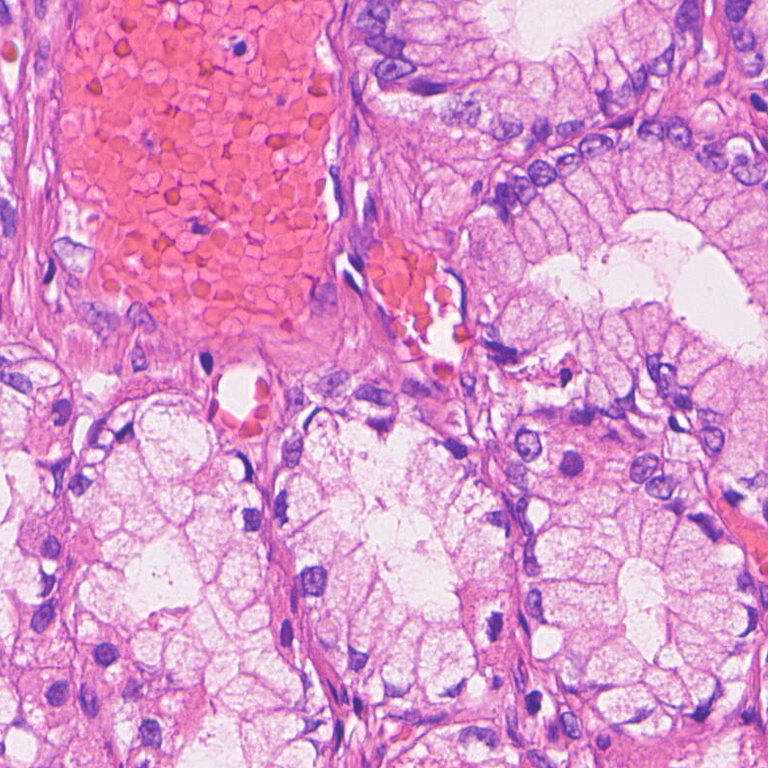
What the real fields measure as. The two numbers used throughout are: holes — the share of closed gland rings that enclose a pale lumen (real held‑out medians 0.81 gastritis, 0.77 metaplasia, 0.77 mixed, 0.88 normal); and D — a distance from real tissue on 54 classical measurements of nuclei, stroma, stain and texture, calibrated on 24 real training fields per category (real held‑out fields themselves sit at a median D of 4.2 gastritis, 2.6 metaplasia, 3.7 mixed, 3.3 normal, with a maximum of 8.0 / 4.5 / 4.4 / 4.3). An image is "inside the real band" when its D is at or below that maximum.
2. Best images across all runs, per category
Four families of method produced candidates. They differ in where the tissue layout comes from, which matters for a later stage where inputs would be patient slides:
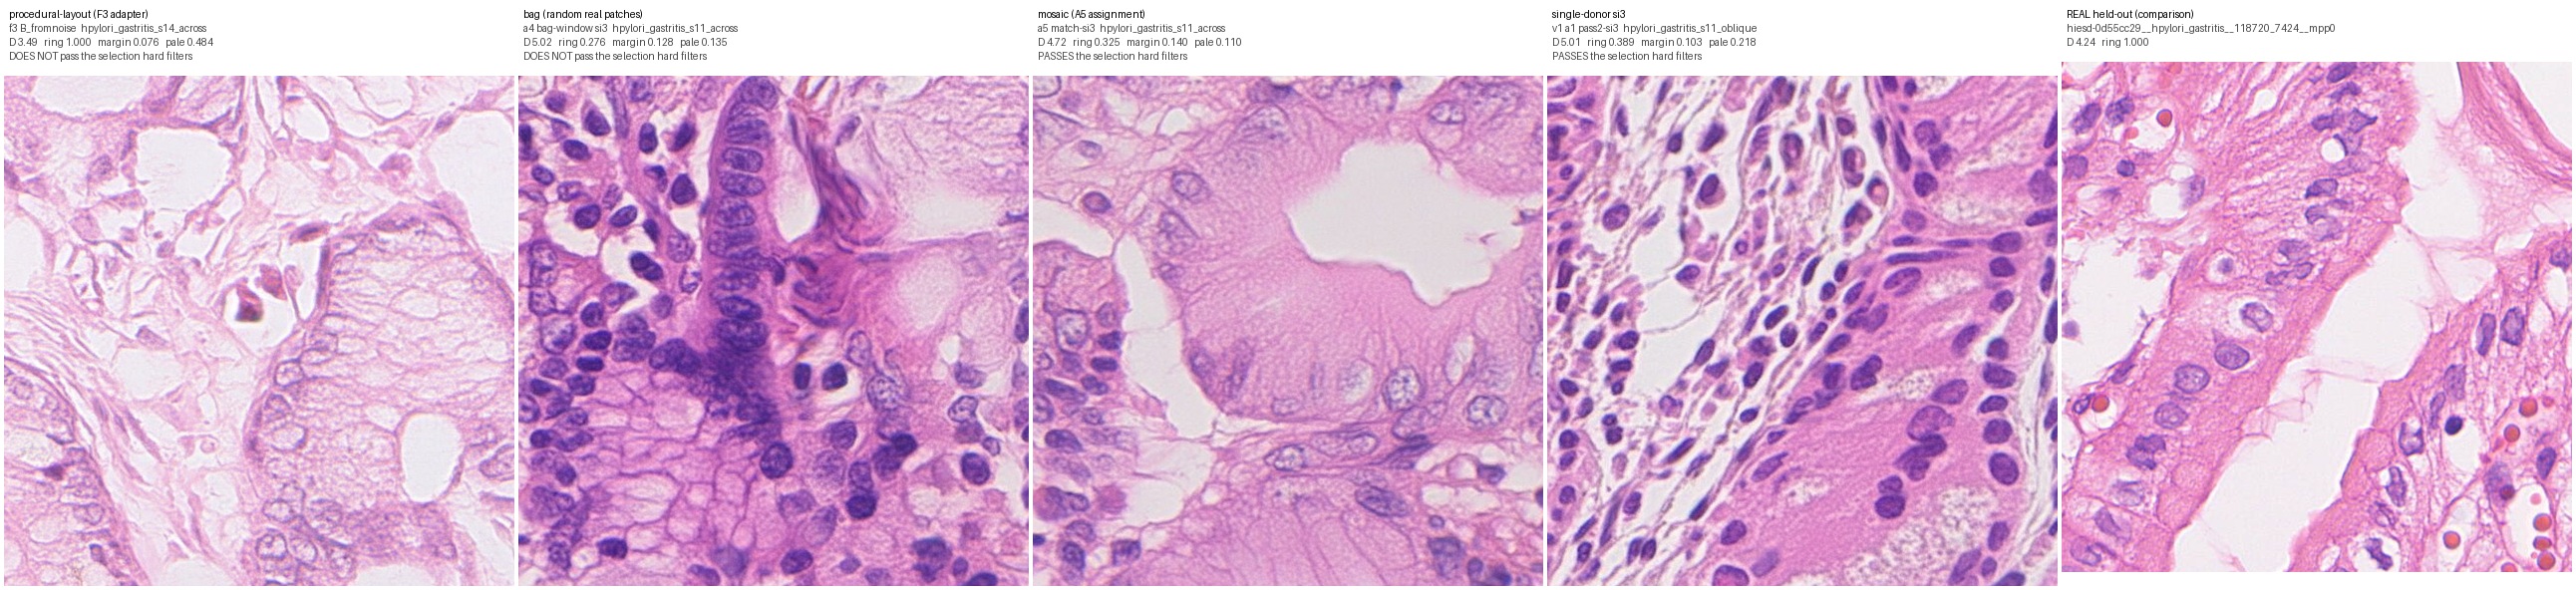
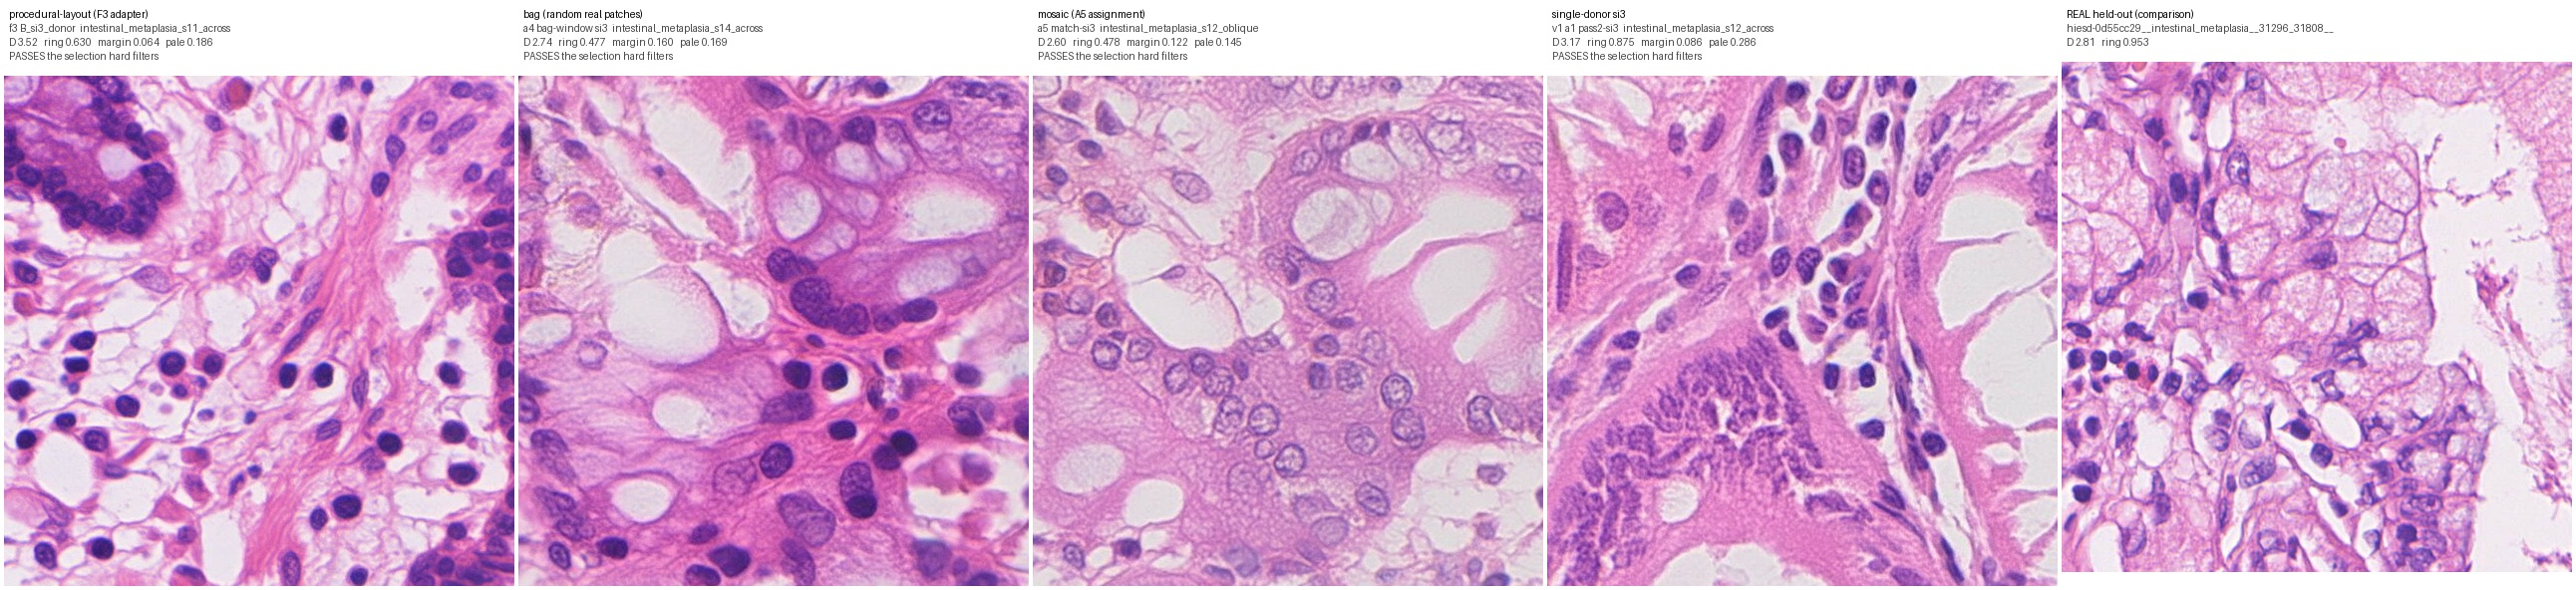
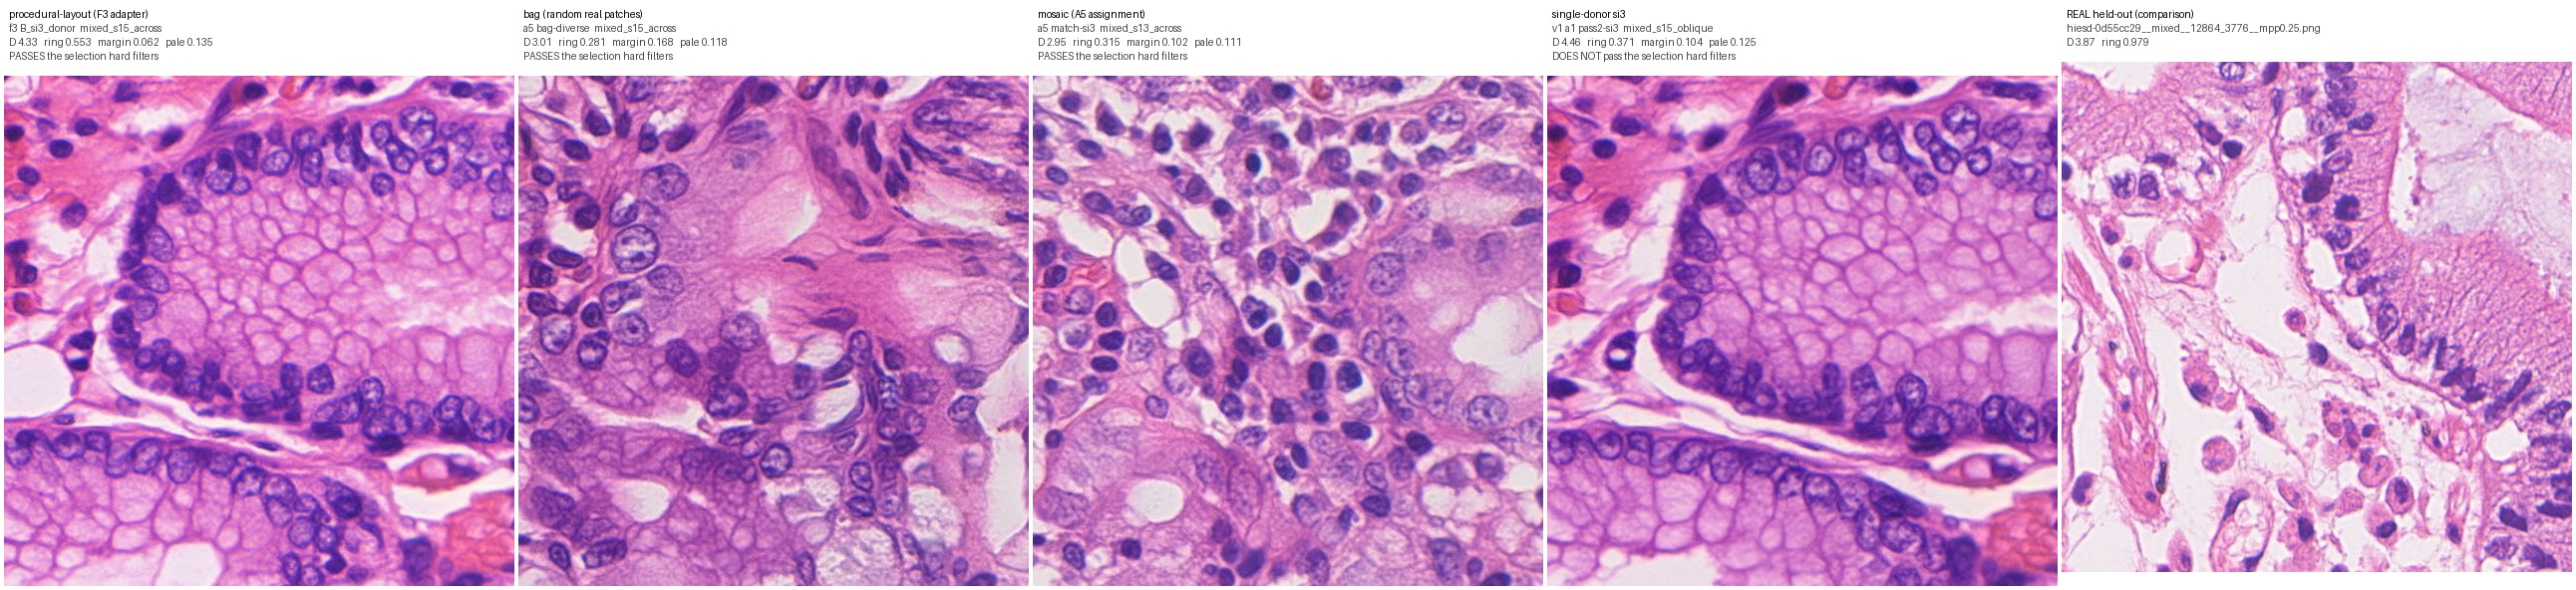
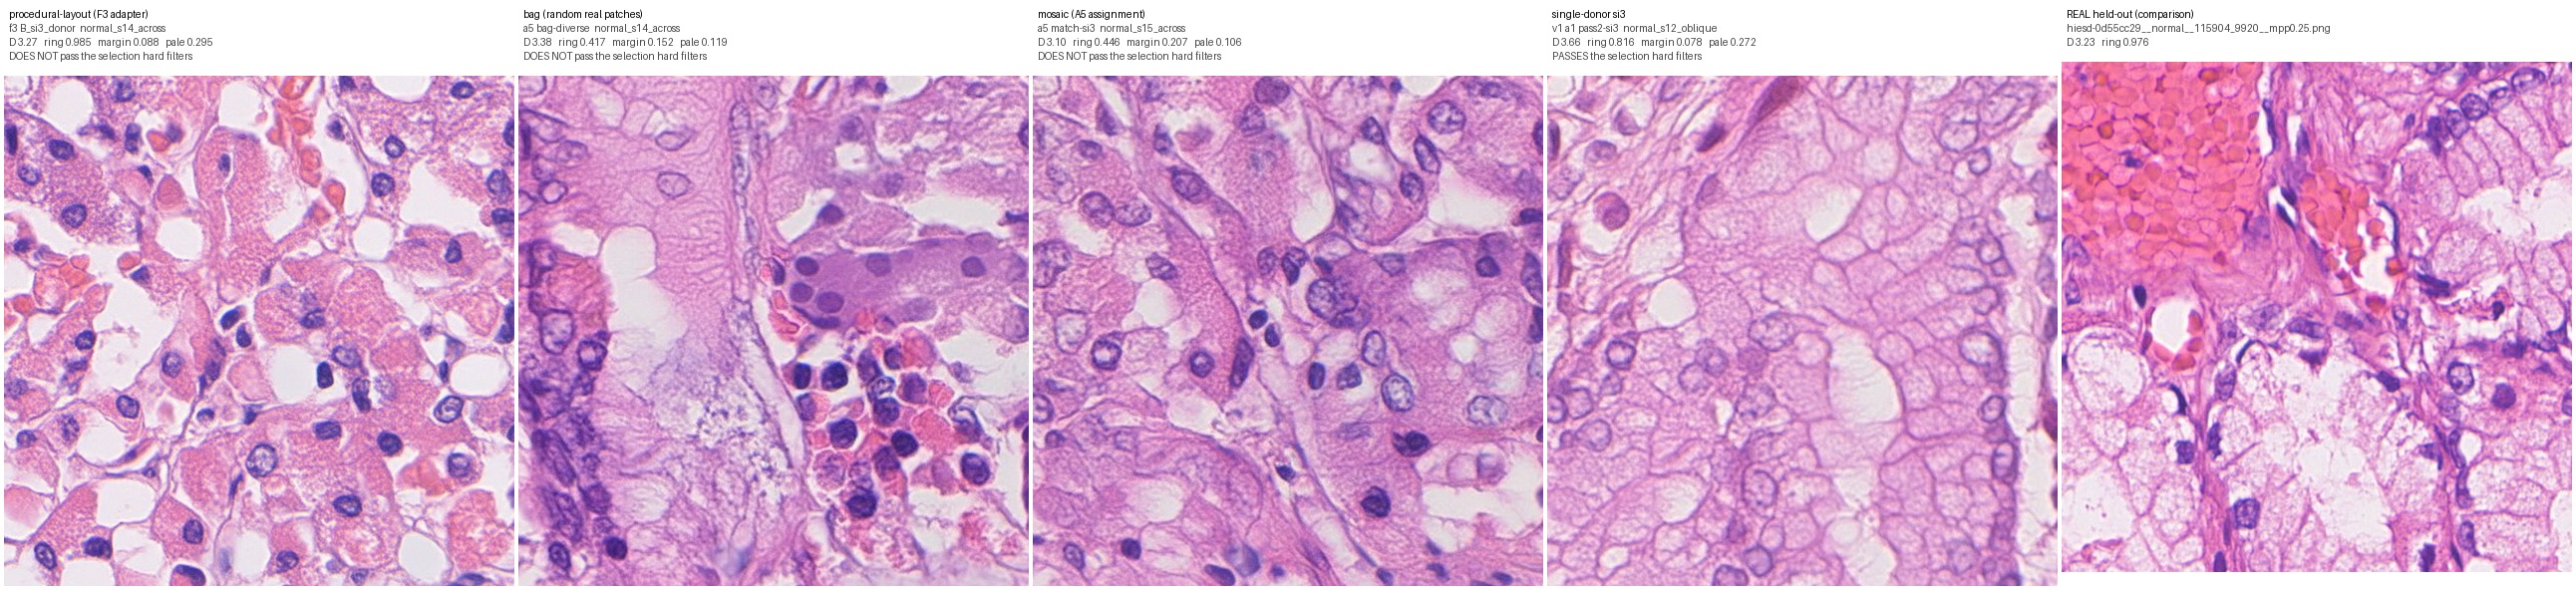
| Family | Layout comes from | Appearance comes from | Provenance note |
|---|---|---|---|
| single‑donor repaint | one real public field | the same field | re‑draws that field's arrangement with new cells |
| mosaic (A5) | ~10–12 real fields, one per window, chosen to match a synthetic drawing | those fields | no single slide's arrangement; still real arrangements |
| bag of patches (A5) | none in particular | random patches of many fields | cleanest provenance; layout is the model's own |
| procedural layout (F3) | our 3‑D tissue drawing, through a trained adapter | one real field's tokens | the only family whose arrangement is synthetic by construction |
The sheets below show, per category, the lowest‑D image of each family (512 px at 1:1) beside the real reference. A label says whether that image also passed the selection filters in section 3.
| Category | Procedural layout | Bag of patches | Mosaic | Single donor |
|---|---|---|---|---|
| Gastritis | D 3.49 (fails pale rule) | D 5.02 | D 4.72 | D 5.01 |
| Metaplasia | D 3.52 | D 2.74 | D 2.60 → final 04 | D 3.17 |
| Mixed | D 4.33 | D 3.01 | D 2.95 → final 06 | D 4.46 |
| Normal | D 3.27 (→ final 10, see §3) | D 3.38 | D 3.10 | D 3.66 → final 08 |
3. The ten proposed submissions
Selection rule. From every heavy‑repaint or adapter output of the programme with per‑image measurements (244 canvases), keep an image only if (1) its D is inside its category's real band — for gastritis additionally its pale‑tissue fraction is within 1.5× real, to exclude faded fields that score well on holes; (2) its hole score is inside the real held‑out range; (3) its copy‑screen margin is at least 0.05 below the fail line and no pixel window matches a real field; (4) no two finals share a drawing seed within a category; (5) no two finals of a category are more than 0.75 similar. Survivors were ranked by D, ties broken toward synthetic layout provenance, then checked by eye at 1:1 against the real reference. Two relaxations were made and are stated under the table.
| # | Category (as labelled) | Family | D (real max) | Holes (real range) | Copy margin | Organisms |
|---|---|---|---|---|---|---|
| 01 | H. pylori gastritis | procedural layout | 3.85 (8.0) | 0.90 (0.30–1.00) | 0.053 | 90 |
| 02 | H. pylori gastritis | procedural layout | 4.55 (8.0) | 0.64 | 0.050 | 90 |
| 03 | H. pylori gastritis | mosaic | 4.99 (8.0) | 0.46 | 0.146 | 78 |
| 04 | Intestinal metaplasia | mosaic | 2.60 (4.5) | 0.48 (0.13–0.95) | 0.122 | – |
| 05 | Intestinal metaplasia | mosaic | 2.64 (4.5) | 0.43 | 0.137 | – |
| 06 | Mixed | mosaic | 2.95 (4.4) | 0.32 (0.27–1.00) | 0.102 | 42 |
| 07 | Mixed | mosaic | 3.50 (4.4) | 0.38 | 0.110 | 36 |
| 08 | Normal | single donor | 3.66 (4.3) | 0.82 (0.67–0.98) | 0.078 | – |
| 09 | Normal | procedural layout | 4.24 (4.3) | 0.69 | 0.085 | – |
| 10 | Normal | procedural layout | 3.27 (4.3) | 0.985 (0.009 above the real max; see below) | 0.088 | – |
Relaxations, stated. Image 07 was first chosen by the rule as a bag‑of‑patches image at D 3.01 that turned out to have no surface or lumen large enough to carry the organism overlay; it was replaced by the next mosaic survivor of the same seed at D 3.50, which does. Image 10 was first admitted at D 7.12, outside the normal band; it was replaced by an image at D 3.27 that had been excluded only because its hole score (0.985) exceeds the maximum of the four real held‑out normal fields (0.976) by 0.009.
Screens on the ten final files. Pathology‑encoder similarity to any of 118 real fields: maximum 0.90 against a fail line of 0.95, zero flagged tiles. Pixel search: maximum window correlation 0.79 against a flag at 0.92, zero flagged windows. Neither screen tests inherited arrangement, which is disclosed per image below.
The images
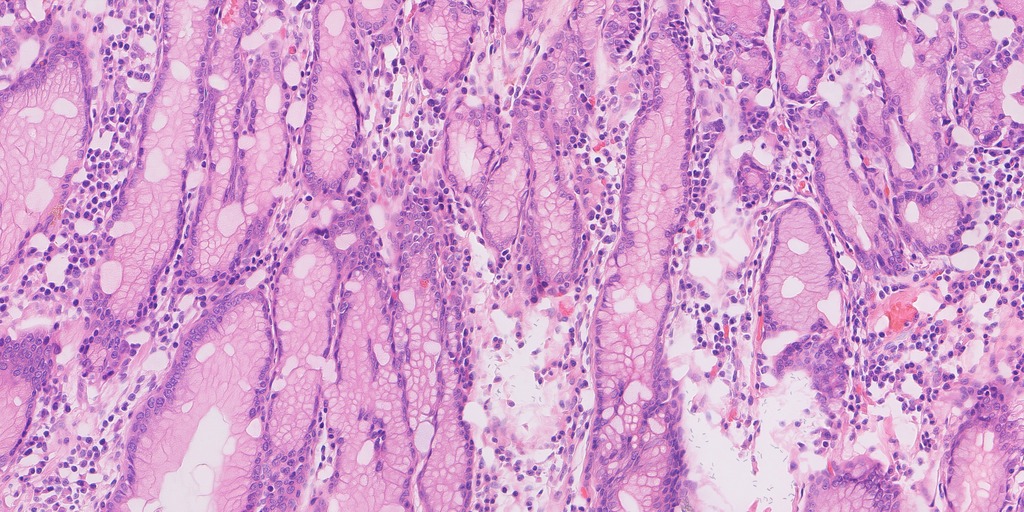
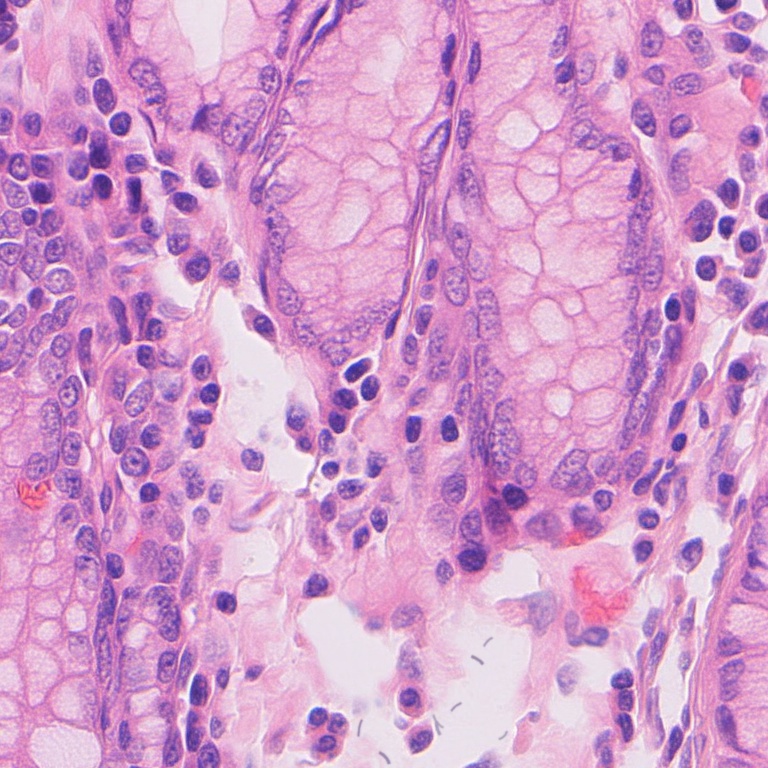
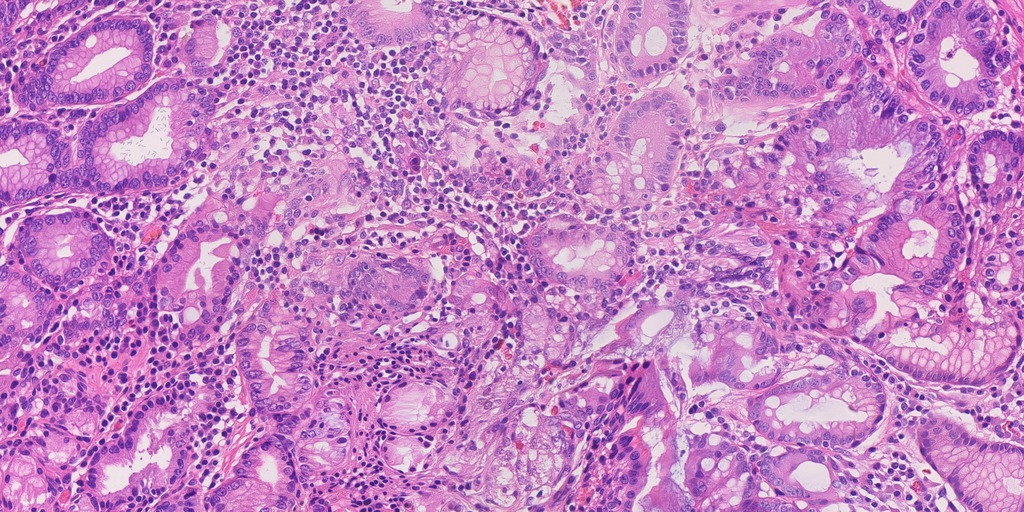
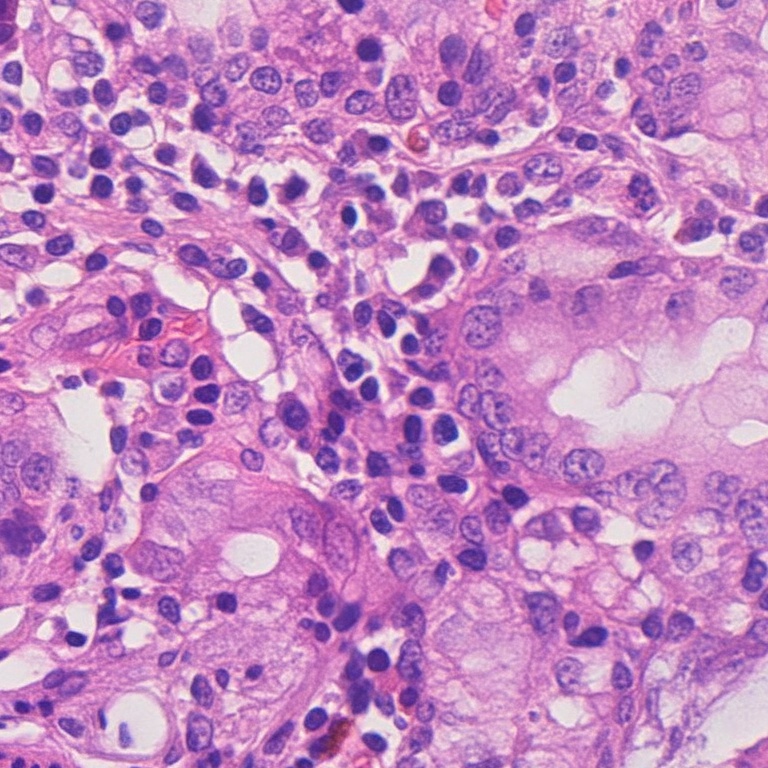
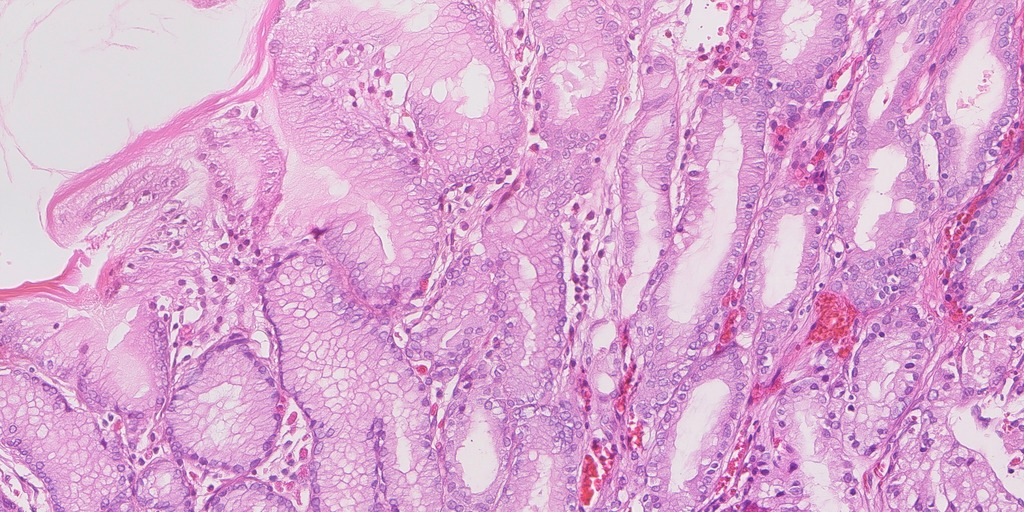
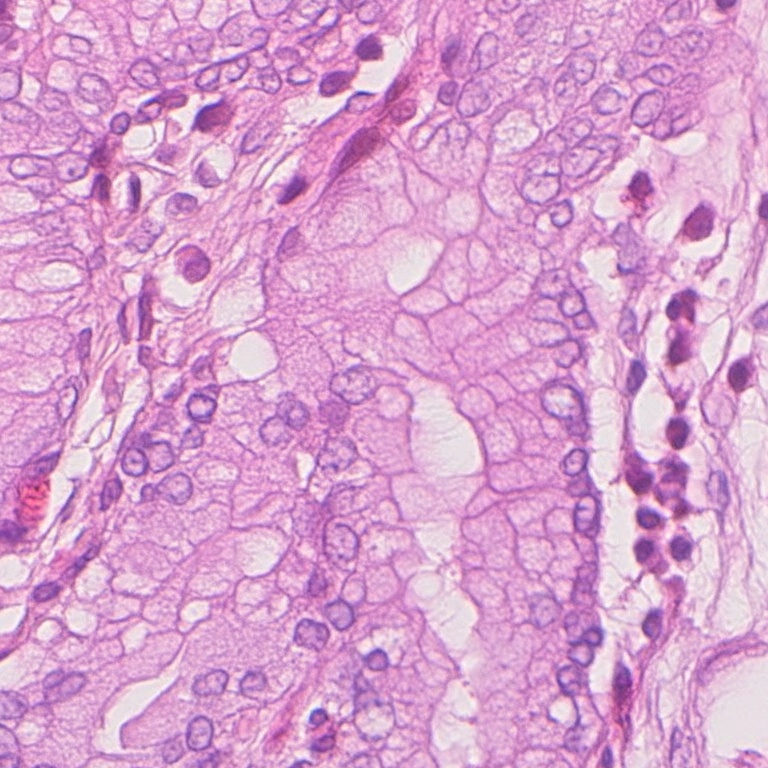
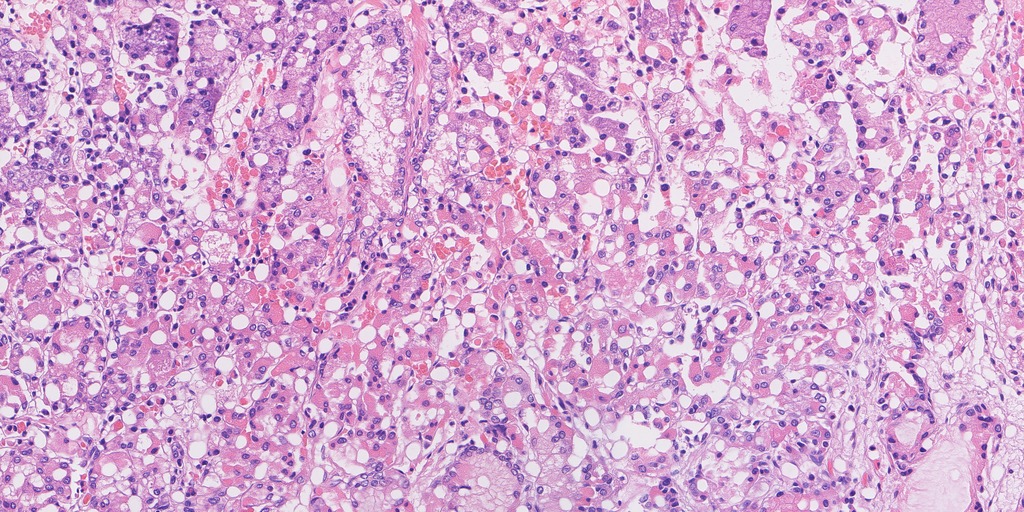
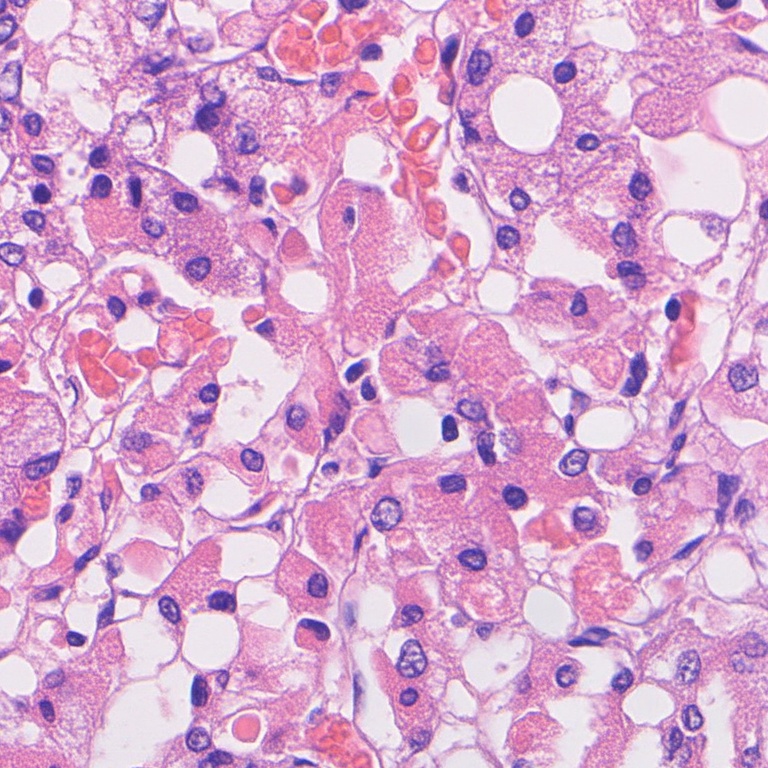
Each pair: the full field at 1024 px, and a 768‑pixel window at native resolution at the same canvas position as the real reference crops in section 1.
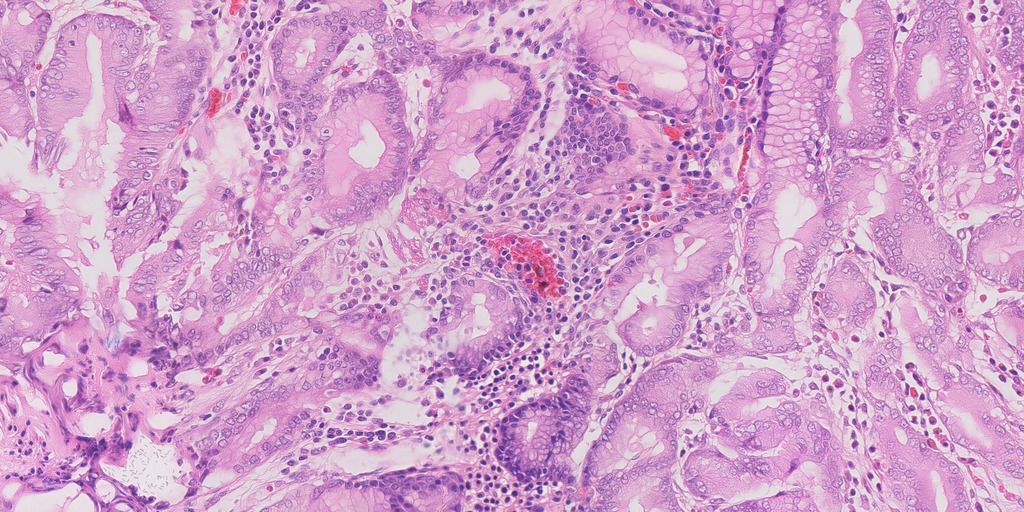
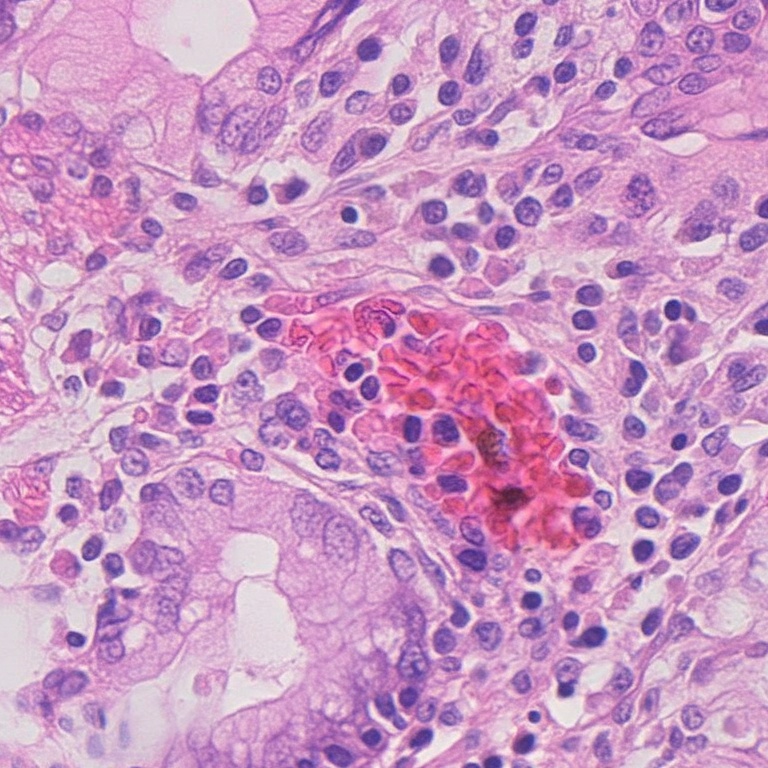
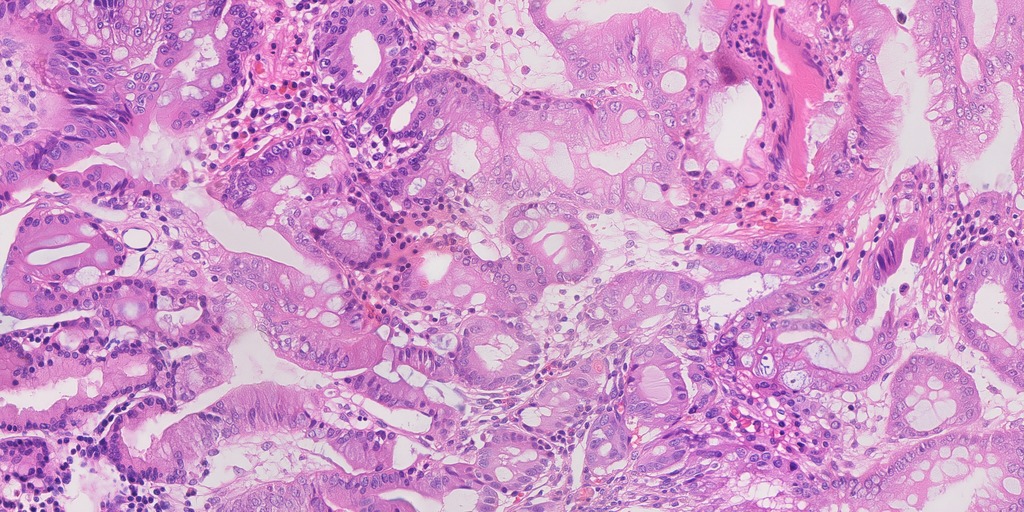
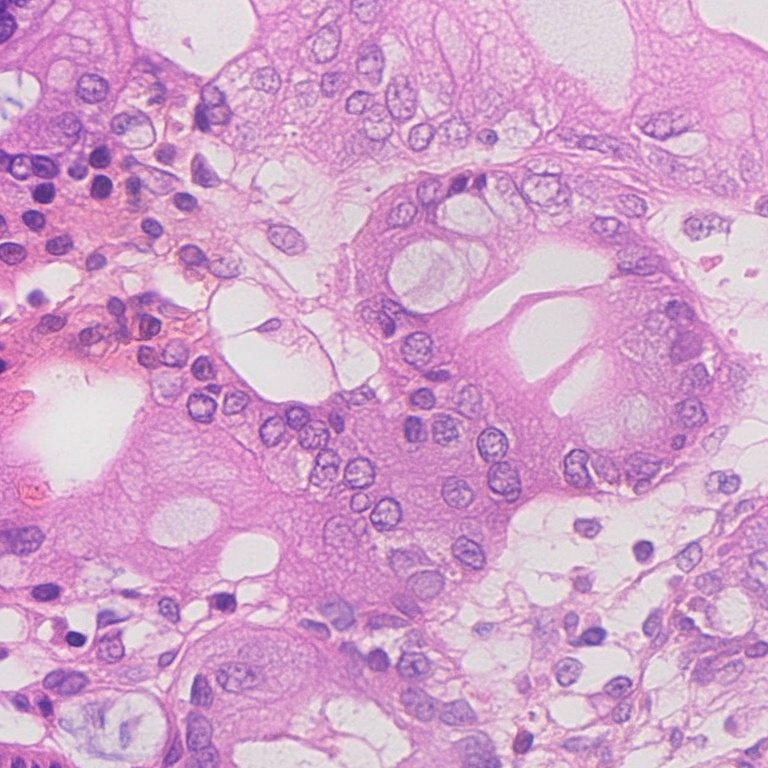
4. Methodology
The method has five stages. Each was measured before the next was built, and several earlier candidates for each stage were rejected on those measurements.
1. Real reference fields. From the 17 HiESD slides, 24 fields per category at 0.25 µm/px were extracted from 13 training slides, plus 22 fields from 3 held‑out slides used only for measurement. No SGH data was used.
2. Two instruments. A realism envelope: 54 classical measurements per field (nuclear count, size, shape and spacing along the gland wall; stroma fibre orientation; stain colour; texture), fitted on the training fields per category so that a generated image gets a distance D from real tissue, calibrated on the held‑out fields. A hole score: the share of closed gland rings enclosing a pale lumen. The envelope was needed because the hole score alone rewards faded images (fading a real field 40% toward white raises its hole score from 0.80 to 0.97).
3. A synthetic layout. A program builds a small 3‑D model of stomach lining — hollow gland tubes of the right diameters, pits, a dense inflammatory sheet and lymphoid follicles for gastritis, goblet vacuoles for metaplasia, a fibrous band at the base — slices it at a chosen angle, and emits a crude cartoon plus an exact label map of every pixel. Five presets (normal body and antrum, gastritis, metaplasia, mixed) were tuned until the cartoons' measurements sat inside the real range.
4. A pathology image model, driven three ways. The generator is PixCell‑1024, a diffusion model trained on pathology images, which paints a 1024‑px window from 16 appearance tokens produced by the UNI2‑h encoder; a 4096×2048 field is 21 overlapping windows on one shared canvas. A finding made during this work shapes everything: at any repaint deep enough to render convincing cells, the appearance tokens decide the layout of the output, and the start image barely matters. So three ways of choosing tokens were used for the final ten:
- Single donor (image 08): tokens from one real field; the cartoon is repainted twice (a light pass, then a heavy pass). Realistic cells; arrangement inherited from that field.
- Mosaic (images 03–07): for each window, the real window — out of 504 candidates and 8 flips/rotations — whose gland walls and holes best overlap the cartoon's; heavy repaint. The most realistic images of the programme (D 3.9 median against 6.3 for a single donor), with no single slide supplying the field and no visible seams.
- Procedural layout (images 01, 02, 09, 10): a small trainable attachment (8 M parameters) teaches the frozen model to read the label map directly. Trained on 96 real fields automatically segmented into the same labels, with the nucleus labels removed so that it controls architecture without stamping nuclei. Its outputs follow the drawing (rotate the map and the tissue rotates, in all four categories) and match real nuclear count and size; D 4.6 median, the first configuration with a synthetic arrangement and realistic cells at once.
5. Organisms, screens and selection. The programme had not verified a suitable organism-positive training set; its bounded HiESD search found no likely organisms, so for the five H. pylori‑category images clustered faint curved rods, 2–4 µm long, are drawn procedurally inside surface mucus and pit or gland lumina, each recorded in a sidecar file. Every final passed a pathology‑encoder copy screen against all 118 real fields and a pixel‑level window search. The ten were then chosen by the rule in section 3 and checked by eye.
Rejected along the way, on measurement: hand‑painted layouts over real photos (the model kept the photo's arrangement when the painting was rotated); locking the lumens during generation (no effect at useful strengths, punched‑out holes at strong ones); a lighter or a third repaint (worse on every axis); more photorealistic cartoons (no effect on output); shuffled or averaged tokens (no layout gain; averages give structureless cell suspensions); conditioning on real surface windows (mucus over the whole field); and the first, nucleus‑aware adapter (right arrangement, twice too many undersized nuclei).
Compute. Eighteen work packages, 1,132 generated fields, 25.7 hours on rented A100 GPUs, about USD 56.
5. Disclosures and open items
- No clinical review. Nothing here establishes that any image is diagnostically correct. The category names are the HiESD labels of the fields each image was generated for. Where the label outruns the picture it is said in the captions: goblet cells are not crisply identifiable in 04 and 05; the inflammatory infiltrate is thin in 02, 03 and 06; the organisms are drawn.
- Provenance. Images 01, 02, 09 and 10 carry a synthetic arrangement but lean on one real field's appearance; images 03–07 inherit arrangements from about ten real fields each; image 08 inherits one field's arrangement. All source fields are public and CC BY 4.0 and are named in the per‑image provenance files.
- Detail. Fine texture (sharpness measure 16.5–20.8 against 20.4–23.6 real) remains below real in nine of the ten: real nuclei carry speckled chromatin that none of these reproduce at 1:1.
- Licensing. PixCell‑1024 and UNI2‑h licence terms for a company submission are unresolved. The evaluation encoder (phikon‑v2, non‑commercial) is used only as an internal screen. HiESD requires attribution.
- Package.
images/SGH_synthetic_01..10.png,metadata.csv,SHA256SUMS,provenance/*.json, overlay sidecars and screen results are inoperations/research/sgh-submission-20260909/. The repository's submission builder still lists six human sign‑off gates (clinical review, disease truth, scale fidelity, layout retention, rights, authority) that this document does not fill.